| Issue |
A&A
Volume 665, September 2022
|
|
|---|---|---|
| Article Number | A138 | |
| Number of page(s) | 8 | |
| Section | Planets and planetary systems | |
| DOI | https://doi.org/10.1051/0004-6361/202243345 | |
| Published online | 21 September 2022 | |
How drifting and evaporating pebbles shape giant planets
III. The formation of WASP-77A b and τ Boötis b
1
Max-Planck-Institut für Astronomie,
Königstuhl 17,
69117
Heidelberg, Germany
e-mail: This email address is being protected from spambots. You need JavaScript enabled to view it.
2
Niels Bohr Institutet, Københavns Universitet,
Blegdamsvej 17,
2100
København, Denmark
3
Institute of Astronomy, KU Leuven,
Celestijnenlaan 200D,
3001
Leuven, Belgium
Received:
17
February
2022
Accepted:
13
July
2022
Abstract
Atmospheric abundances of exoplanets are thought to constrain the planet formation pathway because different species evaporate at different temperatures and therefor radii in the protoplanetary disk, leaving distinct signatures inside the accreted planetary atmosphere. In particular the planetary C/O ratio is thought to constrain the planet formation pathway because of the condensation sequence of H2O, CO2, CH4, and CO, resulting in an increase in the gas phase C/O ratio with increasing distance to the host star. Here we use a disk evolution model including pebble growth, drift, and evaporation coupled with a planet formation model that includes pebble and gas accretion as well as planet migration to compute the atmospheric compositions of giant planets. We compare our results to the recent observational constraints of the hot Jupiters WASP-77A b and τ Boötis b. WASP-77A b’s atmosphere features subsolar C/H, O/H, and H2O/H with slightly super-solar C/O, while τ Boötis b’s atmosphere features super-solar C/H, O/H, and C/O with subsolar H2O/H. Our simulations qualitatively reproduce these measurements and show that giants similar to WASP-77A b should start to form beyond the CO2 evaporation front, while giants similar to τ Boötis b should originate from beyond the water ice line. Our model allows for the formation of subsolar and super-solar atmospheric compositions within the same framework. On the other hand, simulations without pebble evaporation, as used in classical models, cannot reproduce the super-solar C/H and O/H ratios of τ Boötis b’s atmosphere without the additional accretion of solids. Furthermore, we identify the a viscosity parameter of the disk as a key ingredient regarding planetary composition because the viscosity drives the inward motion of volatile enriched vapor, which is responsible for the accretion of gaseous carbon and oxygen. Depending on the planet’s migration history through the disk across different evaporation fronts, order-of-magnitude differences in atmospheric carbon and oxygen abundances should be expected. Our simulations additionally predict super-solar N/H for τ Boötis b and solar N/H for WASP-77A b. We thus conclude that pebble evaporation is a key ingredient to explain the variety of exoplanet atmospheres because it can explain both subsolar and super-solar atmospheric abundances.
Key words: accretion, accretion disks / planets and satellites: formation / planets and satellites: composition / planets and satellites: atmospheres
© B. Bitsch et al. 2022
 Open Access article, published by EDP Sciences, under the terms of the Creative Commons Attribution License (https://creativecommons.org/licenses/by/4.0), which permits unrestricted use, distribution, and reproduction in any medium, provided the original work is properly cited.
This article is published in open access under the Subscribe-to-Open model.
Open Access funding provided by Max Planck Society.
1 Introduction
Planet formation models are mostly constrained by the observed mass, radius, and orbital distance distributions of exoplanets and their corresponding occurrence rates (e.g., Ida & Lin 2008; Mordasini et al. 2009; Guilera et al. 2014; Bitsch & Johansen 2017; Ndugu et al. 2018; Mulders et al. 2018; Alessi et al. 2020). However, current and future observations will expand on the constraints on planet formation by adding atmospheric abundances to the data. The link of atmospheric abundances to planet formation models are mostly discussed via the planetary C/O ratio (e.g., Öberg et al. 2011; Madhusudhan et al. 2017; Booth et al. 2017; Cridland et al. 2020; Schneider & Bitsch 2021a), which changes with distance to the host star due to the condensation of different carbon- and oxygen-bearing species at different disk temperatures (e.g., H2O, CO2, CH4, and CO). Additionally, nitrogen has been discussed as a potential tracer for the formation location of exoplanets (Brogi & Line 2019; Turrini et al. 2021), and also for Jupiter (Bosman et al. 2019; Öberg & Wordsworth 2019; Schneider & Bitsch 2021b).
Detailed observations of atmospheric abundances of exoplanets are still quite rare compared to the majority of observed exoplanets; however, with increasing measurement precision, we are beginning to see a diversity in atmospheric properties. Some planets appear to have subsolar abundances of water (e.g., MacDonald & Madhusudhan 2017; Colón et al. 2020), whereas others are metal-rich (e.g., Wakeford et al. 2018). Even though there is substantial scatter in the mass-atmospheric metallicity relation, there may be an overall tendency for hot Jupiters to be water-poor (Welbanks et al. 2019). On the other hand, it was suggested that the super-stellar alkali metal abundance of some of these hot Jupiters (Welbanks et al. 2019) might be consistent with inward migration and accretion of planetesimals rich in refractories, but poor in water ice (Hands & Helled 2022). However, this process ignores that large amounts of volatiles, and even evaporated refractories could be accreted via the gas phase, depending on the migration history of the giant planet (Booth et al. 2017; Schneider & Bitsch 2021a,b). Additionally, Guillot & Hueso (2006) suggested that a large fraction of the heavy element content of giant planets could be accreted at the late stages of the disk evolution, where photoevaporation mainly removes hydrogen and helium from the disk, leading to a natural enrichment of heavy elements. However, a general application of this theory would have difficulties explaining subsolar compositions. Furthermore, outer giant planets could block inward flowing pebbles, depleting the inner disks of volatiles and pebbles (Morbidelli et al. 2016; Bitsch et al. 2021; Schneider & Bitsch 2021a) and thus altering the composition of growing planets (e.g., Bitsch et al. 2021).
Recent observations of exoplanet atmospheres were not only able to constrain single molecules precisely, but also to derive C/H, O/H, C/O, and H2O/H within the planetary atmospheres with great precision. Line et al. (2021) observed subsolar C/H, O/H, and H2O/H with a slightly super-solar C/O in the atmosphere of the 1.8 MJup inflated (1.2 RJup) hot Jupiter WASP-77A b, orbiting its host star in 1.36 days. In contrast, Pelletier et al. (2021), using SPIRou/CFHT, reported super-solar C/H and O/H with slightly super-solar C/O in combination with a subsolar water abundance in the atmosphere of the 6 Jupiter mass hot Jupiter t Boötis b, which orbits its host star in 3.3 days. Observing the same planet, Webb et al. (2022) reported a near solar water abundance of the same planet using observations via NIR CARMENES, clearly indicating that the water abundance of τ Boötis b is still debated. We note that these observations pertain to the dayside of these planets, implying that the abundances may be affected by disequilibrium processes linked to zonal flows and strong dayside and nightside temperature variations (e.g., Showman & Guillot 2002). Furthermore, interior processes and chemical reactions in the planetary atmosphere might influence the water abundance in the upper atmosphere (e.g., Mollière et al. 2015; Baeyens et al. 2021). As a consequence, it is difficult to draw definite conclusions on planet formation just from the water abundance alone, which is why we mostly rely on C/H and O/H to derive conclusions for our planet formation model.
Even though evidence seems to indicate that the atmospheric abundance is not a tracer of the bulk abundances (e.g., Helled et al. 2021; Guillot et al. 2022), in also considering recent constraints from Jupiter (Wahl et al. 2017; Vazan et al. 2018; Debras & Chabrier 2019; Miguel et al. 2022) and Saturn (Mankovich & Fuller 2021), we nevertheless adopt – for simplicity – the assumption that the atmospheric abundance is a tracer of the bulk abundances. In this work we focus on planet formation simulations in disks governed by pebble growth, drift, and evaporation to study the atmospheric abundances of growing and migrating planets. In addition to the orbital parameters and planetary masses, we specifically focus to match the atmospheric constraints of WASP-77A b (Line et al. 2021) and τ Boötis b (Pelletier et al. 2021) because these planets represent the two extreme ends of the exoplanet population: subsolar and supersolar abundances, where both extremes have to be matched within the same planet formation scenario. Furthermore, their formation is not only constrained through the C/O ratio, but also through C/H and O/H, which are not available for most other observed exoplanets, giving the highest level of constraints to planet formation models. In the following we present a planet formation model that can explain subsolar and super-solar atmospheric abundances without invoking the additional accretion of solids into planetary atmospheres, as required by classical models where pebble evaporation is not taken into account (Öberg et al. 2011).
2 Planetary growth model
The planet formation model we use is described in detail in Schneider & Bitsch (2021a). In particular, the model includes pebble growth and drift (Birnstiel et al. 2012), pebble evaporation and condensation at ice lines (Schneider & Bitsch 2021a), planet growth via pebble (Johansen & Lambrechts 2017) and gas accretion (Ndugu et al. 2021), as well as planet migration (Paardekooper et al. 2011; Benítez-Llambay et al. 2015). The initial planetary mass is set by the pebble transition mass at which the planet starts to accrete efficiently from the Hill regime (Lambrechts & Johansen 2012). During the buildup of the planetary core, we attribute 10% of the accreted pebbles to a primordial heavy element atmosphere. The planet switches to gas accretion once it has reached its pebble isolation mass (Lambrechts et al. 2014; Bitsch et al. 2018), at which point the planet opens a small gap in the protoplanetary disk, preventing further pebble drift interior to the planet. At this stage, the planet can only accrete a gaseous component (including H, He, and volatiles), but it is unable to accrete any solids. This accretion picture is fundamentally different to an accretion scenario including planetesimals, which could still be accreted into planetary atmospheres once the planet starts to accrete an envelope (e.g., Alibert et al. 2018), giving rise to abundance differences in refractories and volatiles in planetary atmospheres (Schneider& Bitsch 2021b).
In contrast to the classical step-function picture of the gas phase C/O (Öberg et al. 2011), the evaporation of inward drifting pebbles allows for more extreme C/O ratios in the gas phase of the disk (e.g., Schneider & Bitsch 2021a), where the C/O ratio over the whole disk radius can vary over a few orders of magnitude, depending on which carbon or oxygen rich materials evaporate (e.g., the C/O ratio is strongly subsolar just interior to the water ice line due to the evaporation of water ice) and how fast the vapor moves through the disk. Furthermore, this effect allows for super-solar abundances of oxygen and carbon in the gas phase, which is unachievable in a model without pebble evaporation.
We investigate here the growth and migration of planetary embryos starting at three different locations (3.5, 10, and 30 au) in disks with three different α viscosity parameters (α = 10–4, 5 × 10⁻⁴, 10–3). We change the initial planetary positions and a viscosity parameters in Sect. 4. We further assume a solar composition for the different chemical elements (Asplund et al. 2009) with a solar dust-to-gas ratio (є0 = 0.0124), motivated by the measured near solar abundances of WASP-77A (Kolecki & Wang 2022).
Here we follow a model where 60% of all carbon is locked in refractories (Schneider & Bitsch 2021b), motivated by the inter stellar medium (ISM) carbon abundances (Bergin et al. 2015). As a consequence, 20% of all carbon grains contribute to CO, 10% to CH4, and 10% to CO2. We do not include a chemical evolution model because the drift timescales are shorter than the chemical reaction timescales (Booth & Ilee 2019). We note that the chemical composition of the material that the planet accretes strongly depends on the composition of the material in the disk, which is normally assumed to be linked to the stellar abundances. We will investigate the effects of varying stellar abundances on planetary compositions in a future work. We use the standard disk parameters from our previous simulations (Schneider & Bitsch 2021a,b), shown in Table A.1 and discussed in Appendix A.
In Fig. 1, we show the growth tracks of nine planets in their corresponding disks with varying α and the initial orbital position. The planetary growth and migration is strongly influenced by the disk’s viscosity because the viscosity sets the migration rate and when the planets are able to open gaps1 (Crida & Morbidelli 2007). Additionally, the viscosity sets the gas accretion rates once the gap is opened and the planet can only accrete what the disk can provide (Bergez-Casalou et al. 2020; Ndugu et al. 2021). As a result, planets in disks with higher viscosities grow larger and migrate more compared to their counterparts in disks with lower viscosities. The initial outward migration of the planets starting at 3.5 au is driven by the heating torque, which acts efficiently due to the fast accretion of pebbles (Benítez-Llambay et al. 2015; Baumann & Bitsch 2020). During their migration, the planets cross different evaporation fronts and can then start to accrete the corresponding evaporated material with the gas.
Starting from a given orbtial position, we integrate until the final planetary masses of WASP-77A b and τ Boötis b have been reached. We make the assumption that the protoplanetary disk dissipates once the final planetary mass has been reached. This implies that the formation of τ Boötis b takes longer than the formation of WASP-77A b because τ Boötis b needs to accrete more material. This results in typical disk lifetimes between 1.5 and 4 Myr, depending on the planet and on the disk’s viscosity (see above).
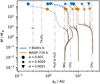 |
Fig. 1 Growth tracks of planets starting at different orbital positions in disks with different viscosities (marked by different symbols). The solid lines mark solid accretion, while the dashed lines mark gas accretion. The dots mark the final masses of WASP-77A b (orange) and τ Boötis b (blue). The evaporation lines for different species are shown for α = 5 × 10⁻⁴ and their distance to the host star increases with increasing α parameter, but they do not evolve in time in our model for simplicity. We note that the growth of the τ Boötis b analogs are a continuation of the growths of the planets resembling WASP-77A b, indicated by a change in color for the corresponding growth tracks. The planetary growth is then stopped once the mass of WASP-77A b or τ Boötis b is reached. |
3 Atmospheric abundances of giant planets
In Fig. 2, we show the atmospheric abundances of the planets shown in Fig. 1. In particular, we focus on C, O, and N as well as on the C/O and the water abundance in the planetary atmospheres, even though our simulations also track other elements (Schneider & Bitsch 2021a,b). We notably include the water abundances because observations seems to indicate that hot Jupiters harbor, tendentially, a subsolar water abundance (Welbanks et al. 2019). The water abundance in Fig. 2 has been calculated using the chemical equilibrium interpolator of petitRADTRANS (Mollière et al. 2020), which determines the chemical abundances assuming that the atmosphere is in chemical equilibrium. The water abundance in such a model is then only dependent on the temperature, the pressure, and the elemental composition of the planet. We calculate the water abundances of τ Boötis b and WASP-77A b by using an average over a pressure range from 10–4 to 10 bar. For the temperature, we assume that both planets are on tidally locked orbits with ap = 0.024 au and ap = 0.046 au for WASP-77A b and τ Boötis b, respectively, leading to equilibrium temperatures of 2366 K and 2314 K, respectively. Using the double gray analytical pressure-temperature profile of Guillot (2010) with an interior temperature of Tint = 200 K, an infrared opacity of κIR = 0.01 cm2 g−1, and an optical opacity of κvis = 0.004 cm2 g–1, we obtain (for reference) a temperature at the 10-3 bar of 2145 K and 2097 K for WASP-77b and τ Boötis b, respectively. The elemental composition which is used to calculate the water abundance with the chemical equilibrium code is consistently inferred from the C/O ratio and the heavy element content of the atmospheres in our planet formation models. We discuss how the lack of pebble evaporation would influence the planetary compositions in Appendix B.
Within our simulations, some very clear trends emerge. Planets accreting most of their material in the inner disk region have super-solar C/H and O/H values, mostly due to the accretion of water and carbon grain vapor, which enriches the gas to super-solar values (in contrast to simulations without pebble evaporation, see Appendix B). Planets migrating interior to the water ice line feature super-solar water abundances, explaining the large water abundances of some observed giant exoplanets without any problems (Wakeford et al. 2018). However, further inward migration across the carbon grain evaporation line increases the planetary C/O, preventing efficient water formation in the atmosphere. The increase in the planetary C/H in the inner disk strongly depends on the amount of carbon grains in the disk.
Planets staying mostly in the outer disk harbor lower C/H and O/H values, which can even be subsolar, especially if the planets do not migrate across the CO2 or H2O ice lines2. As a consequence, these planets accrete mostly CO and CH4 gas (in addition to N2), resulting in super-solar C/O ratios. Only once the planets migrate across the CO2 ice line is a subsolar C/O ratio possible. Additionally, these outer planets all feature a subsolar water abundance in their atmosphere, which is in line with observed exoplanets (Welbanks et al. 2019). These exoplanets could form in the outer disk and then be scattered inward, where they are observed now.
Our simulations predict solar to super-solar nitrogen contents in the giant planets, where the nitrogen content is larger if planets migrate across the NH3 evaporation front. The simulation that matches the C/H and O/H for τ Boötis b best (aP = 3.5 au, α = 10–4) features an N/H content with a similar level of enrichment. In contrast, the simulations that match C/H and O/H of WASP-77A b best (aP = 10 au, α = 10–4 or α = 5 × 10⁻⁴) feature solar N/H. The results for the simulations with different viscosities are similar because both WASP-77A b analogs do not migrate across the CO2 evaporation front.
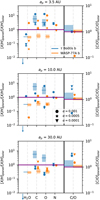 |
Fig. 2 Atmospheric abundances of volatiles normed to solar for the different planets shown in Fig. 1 at the end of their evolution. The initial planetary position increases from top to bottom. The colors mark the different planets, while the different symbols mark the different levels of viscosity. The orange bands mark the measured atmospheric abundances of WASP-77A b (Line et al. 2021), while the blue band marks the constraints for τ Boötis b, where H2O/H is less than 10–2 (Pelletier et al. 2021), as indicated by the blue arrow. The slightly subsolar water measurements of Webb et al. (2022) are marked with the horizontal blue bar. Some of our simulations feature water abundances below 10–2 and are thus not shown in the figure. Please note the different scale for C/O. |
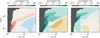 |
Fig. 3 Atmospheric C/O, O/H, and C/H of planets forming in disks with different α viscosity at different initial positions after 3 Myr of evolution. The dark regions correspond to planets that have not reached masses above 100 Earth masses. We note that planets growing in disks with higher viscosities migrate farther and are generally more massive than planets growing in disks with lower viscosities (Schneider & Bitsch 2021a). |
4 Influence of the disk’s viscosity
The viscosity in the protoplanetary disk determines the disk’s evolution (Lynden-Bell & Pringle 1974), but it is also important for the composition of planetary atmospheres because the viscosity sets how fast the vapor originating from evaporating pebbles can move inward. For example, at low viscosity, the CO and CH4 vapor released at their specific evaporation front only reaches the inner edge of the disk at very late times, while this vapor reaches the inner disk regions within a million years at high viscosity (Schneider & Bitsch 2021a).
To stress the importance of the viscosity on the atmospheric abundances, we show in Fig. 3 the atmospheric abundances of planets growing in our model at different initial positions in disks with a different a-viscosity parameter, ranging from 5 × 10⁻⁵ to 5 × 10⁻³. We show the atmospheric C/O, C/H, and O/H of these planets after 3 Myr of disk evolution. As the final planetary masses of the planets in these simulations do not match those of WASP-77A b and τ Boötis b, we do not mark the atmospheric constraints for these planets in Fig. 3.
Our simulations clearly show a dependency of the atmospheric composition on the disk’s viscosity, in contrast to earlier models without pebble evaporation (Öberg et al. 2011)). In particular, subsolar O/H and C/H atmospheric values are only possible in the outer disk regions at low viscosities (α ≤ 10–3). On the other hand, super-solar C/H and O/H ratios are possible in the outer disk at higher viscosities due to the more efficient inward diffusion of CO and CH4 gas. In the inner disk regions, super-solar values of C/H and O/H are easily possible, especially interior to the CO2 and H2O evaporation fronts. Here the exact value of the C/H and O/H ratio also depends on the disk’s viscosity, where larger O/H values are possible at lower viscosity because the smaller viscosity prevents the efficient removal of the water vapor (see Schneider & Bitsch 2021a for a discussion on the disk’s water content).
The atmospheric C/O ratio reveals the already established trends, from simpler models without evaporation (Öberg et al. 2011; Madhusudhan et al. 2017), that the atmospheric C/O increases with increasing distance to the central star at low viscosity. However, the evaporation of inward drifting pebbles allows for more extreme C/O ratios compared to the simple model (see also Appendix B), where C/O ratios below 0.1 and above 4–5 are possible if evaporation is included. However, the parameter space for these extreme values is limited to low viscosities, where the initial pileup of vapor is larger (Schneider & Bitsch 2021a).
5 Model limitations
Recent advances in high resolution observations have enabled precise constraints on the abundances of both carbon- and oxygen-bearing molecules (e.g., Brewer et al. 2017; Welbanks et al. 2019; Giacobbe et al. 2021; Pelletier et al. 2021; Line et al. 2021). Here we explore the success of our model in explaining the measured abundances for two case studies: WASP-77A b (Line et al. 2021) and t Boötis b (Pelletier et al. 2021). In Fig. 2, we show the abundance constraints from WASP-77A b and t Boötis b, where our model is able to qualitatively reproduce these very different abundance measurements, especially in low viscosity environments.
Our model is able to produce subsolar C/H and O/H ratios with a nearly solar C/O ratio for planets forming completely exterior to the CO2 evaporation front which is in line with the observed abundances of WASP-77A b (Line et al. 2021). The inferred super-solar abundances of τ Boötis b (Pelletier et al. 2021) are also reproduced in our model, but they require a formation and migration interior to the CO2 evaporation line, indicating a formation closer to the host star. We stress that our formation scenario is only based on the constraints of C/H, O/H, and C/O and not on the water abundances themselves because the water abundance is not very well constrained at this point (Pelletier et al. 2021; Webb et al. 2022) and can also be influenced by interior processes.
The main assumption of our model is that we can use the atmospheric abundances as a tracer for the bulk abundances of the giant planets. However, this assumption is certainly under debate (Helled et al. 2021; Guillot et al. 2022). If compositional gradients inside of the planet exist, then the atmospheric abundances only represent the minimum abundance of a specific chemical element. Future simulations dedicated to linking atmospheric abundances to planet formation need to take detailed interior models into account.
Our planet formation model is of course simplified in many aspects that can influence the planetary abundances, including, for example, the scattering of small dust grains from the outer gap edges into the planetary feeding zone (Bi et al. 2021; Binkert et al. 2021), the accretion of smaller pebble sizes once the core has reached the pebble isolation mass for the dominant pebble size (Andama et al. 2022), as well as further planetesimal bombardment (e.g., Hands & Helled 2022). We also do not include a realistic photoevaporation procedure, which could allow for the enhancement of the heavy elements in the disk midplane due to the loss of hydrogen and helium from the disk’s upper layers, consequently enriching the gaseous component accreted by the planet resulting in super-solar abundances (Guillot & Hueso 2006). In our model, we also do not include the chemical evolution of the gas disk, which can transform the main oxygen and carbon carriers, which also depend on the C/O ratio of the disk (Eistrup et al. 2016), emphasizing the need to constrain stellar abundances so as to constrain planet formation (Reggiani et al. 2022).
Our model implicitly implies that WASP-77A b and τ Boötis b formed further away from their host star and were then scattered inward. While these scattering events are possible (e.g., Juric & Tremaine 2008; Ford & Rasio 2008; Raymond et al. 2009; Sotiriadis et al. 2017; Bitsch et al. 2020), they imply that other perturbers in the disk are present. These perturbers could either block inward drifting pebbles, thus influencing planetary growth (e.g., Morbidelli et al. 2015; Bitsch et al. 2019), or they could have dramatic consequences on the composition of the available solids (e.g., Morbidelli et al. 2016) and gases (Bitsch et al. 2021; Schneider & Bitsch 2021a), requiring a combination of N-body simulations with our planet formation framework presented here to further constrain the formation pathway.
6 Summary and conclusions
In this study, we simulated the growth and migration of planetary embryos to gas giants in disks with different α viscosities to derive their atmospheric abundances. The atmospheric abundances are crucially influenced by the planet’s formation location and migration history (e.g., Öberg et al. 2011; Madhusudhan et al. 2017; Schneider & Bitsch 2021a). Our model shows that the atmospheric C/O increases and that the corresponding C/H and O/H decrease with an increasing planetary formation location; this is in line with the studies referenced in the previous sentence. Our results and conclusions apply under the assumption that the atmospheric composition is a tracer of the bulk composition (but see Helled et al. 2021; Guillot et al. 2022).
Our simulations can explain the observed subsolar water content of giant planets3 if the planets form exterior to the water ice line or only migrate across the water ice line very late. On the other hand, planets migrating across the water ice line early feature super-solar water contents, which is in line with some observed exoplanets as well (Wakeford et al. 2018). The water content of exoplanets, however, needs to be constrained much better in the future with observations showing a large range in the water abundance of τ Boötis b (Pelletier et al. 2021; Webb et al. 2022). If planets form exterior to the CO2 evaporation front and if they only cross the CO2 evaporation front very late in their evolution, our model can reproduce the measured subsolar C/H and O/H in combination with solar C/O ratios of WASP-77A b (Line et al. 2021).
Furthermore, our model shows that super-solar C/H and O/H ratios are possible when pebble evaporation is taken into account, allowing for a match to the atmospheric measurements of τ Boötis b (Pelletier et al. 2021) if the planet formed exterior to the water evaporation front. This is in contrast to models without pebble evaporation (see Appendix B), which changes the picture put forward by Öberg et al. (2011), where super-solar C/H and O/H ratios in planetary atmospheres are only possible with additional solid accretion4.
The effect of pebble evaporation thus allows for the formation of planetary atmospheres with subsolar and super-solar C/H and O/H. Consequently, our model can match the subsolar abundances of WASP-77A b (Line et al. 2021) and the super-solar abundances of t Boötis b (Pelletier et al. 2021), without invoking additional solid accretion for only one of the planets, making our model more applicable in general.
Our study further emphasizes that nitrogen could be used as a tracer for the planet formation location (Turrini et al. 2021; Schneider & Bitsch 2021b). This is mostly related to its different chemistry and because most of the nitrogen is stored in the super-volatile N2 component (Tevap = 20 K), reducing the complexity compared to carbon- and oxygen-bearing molecules. Our model predicts that τ Boötis b should harbor a super-solar nitrogen abundance, while WASP-77A b’s atmosphere should be around solar in nitrogen (Fig. 2).
Our simulations also show that the effect of pebble evaporation on the composition of planetary atmospheres crucially depends on the disk’s viscosity (Fig. 3). Especially at low viscosities, more extreme subsolar and super-solar C/H and O/H ratios are possible due to the pileup of evaporated material close to the evaporation fronts (Schneider & Bitsch 2021a), where the pile-ups erroded faster at higher viscosity. This clearly shows that not only does the α viscosity play a crucial role for planet formation in itself, but also for the atmospheric abundances of planets and it allows for a wide range of atmospheric abundances. Furthermore, our model implies that a great diversity in atmospheric compositions of hot Jupiters should inevitably be expected from their different formation pathways.
Acknowledgements
B.B. acknowledges the support of the European Research Council (ERC Starting Grant 757448-PAMDORA) and of the DFG priority program SPP 1992 “Exploring the Diversity of Extrasolar Planets (BI 1880/3-1). A.D.S. acknowledges funding from the European Union H2020-MSCA-ITN-2019 under Grant no. 860470 (CHAMELEON). We thank the referee Tristan Guillot for his comments that helped to improve our manuscript.
Appendix A Model parameters
We show in Table A.1 the model parameters used in our study. While we vary the initial planet position and disk viscosity in Section 4, we keep the other parameters the same. Our model assumes a solar composition of the different initial elemental ratios. We integrate the disk’s lifetime until the growing planets have reached the planetary masses of WASP-77A b and τ Boötis b. This approach implies that the disk conveniently disappears when the final planetary masses are reached and it implies a varying disk lifetime, depending on the planetary mass that needs to be reached and on the disk’s viscosity, because giants grow faster in high viscosity environments. The disk’s lifetimes thus vary between 1.5 Myr to 4 Myr. For Fig. 3 we use a fixed lifetime of 3 Myr.
Parameters used throughout this paper.
Appendix B Models without pebble evaporation
Our main model includes the evaporation of inward drifting pebbles that cross ice lines. Here we investigate how the atmospheric composition of planets changes if the evaporation of inward drifting pebbles is not taken into account. We note that this does not influence the growth and migration of the growing planets (Schneider & Bitsch 2021a).
In Fig. B.1 we present the atmospheric composition of planets starting at 3.5, 10, and 30 au in disks with different viscosities without taking the evaporation of pebbles into account (compared to Fig. 2, where evaporation is taken into account). As expected from previous models (Öberg et al. 2011), super-solar C/H, O/H, and N/H ratios cannot be achieved by gas accretion alone, which fails to reproduce the atmospheric constraints of τ Boötis b (Pelletier et al. 2021). Without the contribution of pebble evaporation, super-solar C/H and O/H values can only be achieved if the planet further accretes solids (e.g., planetesimals). This implies that τ Boötis b would need to accrete further solids to explain its super-solar abundance in contrast to WASP-77A b, opening the question of why planetesimal accretion should only be efficient in certain cases. We observe the same effect for the nitrogen abundance, where all planets feature around solar N/H, because the planets migrate across the NH3 evaporation front (where then all nitrogen is in a gaseous component), except if they form in outer regions in low viscosity disks, where 90% of the nitrogen is in gaseous form. All planets that formed in this scenario feature extremely subsolar water abundances, which could be in line with the measurements of Pelletier et al. (2021) for τ Boötis b, but they are in disagreement with the measurements of Webb et al. (2022) for the same planet. However, our formation constraints are derived only from C/H, O/H, and C/O because the water abundances are also heavily influenced by interior processes; this is not studied in detail in this work.
In contrast, the C/O ratio of the planets can become supersolar if the planets form exterior to the water ice line. In fact, the model without evaporation allows a match to the atmospheric constraints of WASP-77A b, which feature subsolar C/H and O/H ratios (Line et al. 2021), already leading to the conclusion that WASP-77A b formed exterior to the water ice line. However, from this model, it is unclear how far away from the water ice line WASP-77A b should have formed, giving limited constraints to planet formation (Fig. B.1). The recent study by Reggiani et al. (2022) also concluded that WASP-77A b should form beyond the water ice line, but their model does not include pebble evaporation either. In contrast, if pebble evaporation is included, a formation beyond the CO2 snow line is needed because, otherwise, too much carbon might be accreted (see Fig. 2 and Fig. 3).
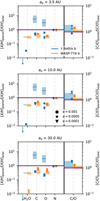 |
Fig. B.1 Atmospheric C/H, O/H, N/H, C/O, and H2O/H content of planets forming at 3.5, 10, and 30 au in disks with different viscosities. Symbols and color codings are the same as in Fig. 2. We do not take the evaporation of inward drifting pebbles into account, in contrast to Fig. 2, resulting in typically subsolar abundances. |
References
- Alessi, M., Pudritz, R. E., & Cridland, A. J. 2020, MNRAS, 493, 1013 [NASA ADS] [CrossRef] [Google Scholar]
- Alibert, Y., Venturini, J., Helled, R., et al. 2018, Nat. Astron., 2, 873 [NASA ADS] [CrossRef] [Google Scholar]
- Andama, G., Ndugu, N., Anguma, S. K., & Jurua, E. 2022, MNRAS, 510, 1298 [Google Scholar]
- Asplund, M., Grevesse, N., Sauval, A. J., & Scott, P. 2009, ARAA, 47, 481 [NASA ADS] [CrossRef] [Google Scholar]
- Baeyens, R., Decin, L., Carone, L., et al. 2021, MNRAS, 505, 5603 [NASA ADS] [CrossRef] [Google Scholar]
- Baumann, T., & Bitsch, B. 2020, A&A, 637, A11 [NASA ADS] [CrossRef] [EDP Sciences] [Google Scholar]
- Benítez-Llambay, P., Masset, F., Koenigsberger, G., & Szulágyi, J. 2015, Nature, 520, 63 [Google Scholar]
- Bergez-Casalou, C., Bitsch, B., Pierens, A., Crida, A., & Raymond, S. N. 2020, A&A, 643, A133 [NASA ADS] [CrossRef] [EDP Sciences] [Google Scholar]
- Bergin, E. A., Blake, G. A., Ciesla, F., Hirschmann, M. M., & Li, J. 2015, Proc. Natl. Acad. Sci. U.S.A., 112, 8965 [NASA ADS] [CrossRef] [Google Scholar]
- Bi, J., Lin, M.-K., & Dong, R. 2021, ApJ, 912, 107 [NASA ADS] [CrossRef] [Google Scholar]
- Binkert, F., Szulágyi, J., & Birnstiel, T. 2021, MNRAS, 506, 5969 [NASA ADS] [CrossRef] [Google Scholar]
- Birnstiel, T., Klahr, H., & Ercolano, B. 2012, A&A, 539, A148 [NASA ADS] [CrossRef] [EDP Sciences] [Google Scholar]
- Bitsch, B., & Johansen, A. 2017, in Astrophysics and Space Science Library, eds. M. Pessah, & O. Gressel, 445, 339 [NASA ADS] [CrossRef] [Google Scholar]
- Bitsch, B., Morbidelli, A., Johansen, A., et al. 2018, A&A, 612, A30 [NASA ADS] [CrossRef] [EDP Sciences] [Google Scholar]
- Bitsch, B., Izidoro, A., Johansen, A., et al. 2019, A&A, 623, A88 [NASA ADS] [CrossRef] [EDP Sciences] [Google Scholar]
- Bitsch, B., Trifonov, T., & Izidoro, A. 2020, A&A, 643, A66 [EDP Sciences] [Google Scholar]
- Bitsch, B., Raymond, S. N., Buchhave, L. A., et al. 2021, A&A, 649, A5 [NASA ADS] [CrossRef] [EDP Sciences] [Google Scholar]
- Booth, R. A., & Ilee, J. D. 2019, MNRAS, 487, 3998 [CrossRef] [Google Scholar]
- Booth, R. A., Clarke, C. J., Madhusudhan, N., & Ilee, J. D. 2017, MNRAS, 469, 3994 [Google Scholar]
- Bosman, A. D., Cridland, A. J., & Miguel, Y. 2019, A&A, 632, A11 [Google Scholar]
- Brewer, J. M., Fischer, D. A., & Madhusudhan, N. 2017, AJ, 153, 83 [NASA ADS] [CrossRef] [Google Scholar]
- Brogi, M., & Line, M. R. 2019, AJ, 157, 114 [Google Scholar]
- Colón, K. D., Kreidberg, L., Welbanks, L., et al. 2020, AJ, 160, 280 [CrossRef] [Google Scholar]
- Crida, A., & Morbidelli, A. 2007, MNRAS, 377, 1324 [Google Scholar]
- Cridland, A. J., van Dishoeck, E. F., Alessi, M., & Pudritz, R. E. 2020, A&A, 642, A229 [NASA ADS] [CrossRef] [EDP Sciences] [Google Scholar]
- Debras, F., & Chabrier, G. 2019, ApJ, 872, 100 [Google Scholar]
- Eistrup, C., Walsh, C., & van Dishoeck, E. F. 2016, A&A, 595, A83 [NASA ADS] [CrossRef] [EDP Sciences] [Google Scholar]
- Ford, E. B., & Rasio, F. A. 2008, ApJ, 686, 621 [Google Scholar]
- Giacobbe, P., Brogi, M., Gandhi, S., et al. 2021, Nature, 592, 205 [NASA ADS] [CrossRef] [Google Scholar]
- Guilera, O. M., de Elía, G. C., Brunini, A., & Santamaría, P. J. 2014, A&A, 565, A96 [NASA ADS] [CrossRef] [EDP Sciences] [Google Scholar]
- Guillot, T. 2010, A&A, 520, A27 [NASA ADS] [CrossRef] [EDP Sciences] [Google Scholar]
- Guillot, T., & Hueso, R. 2006, MNRAS, 367, L47 [CrossRef] [Google Scholar]
- Guillot, T., Fletcher, L. N., Helled, R., et al. 2022, Protostars and Planets VII, submitted [arXiv:2205.0410S] [Google Scholar]
- Hands, T. O., & Helled, R. 2022, MNRAS, 509, 894 [Google Scholar]
- Helled, R., Werner, S., Dorn, C., et al. 2021, Exp. Astron., 53, 323 [Google Scholar]
- Ida, S., & Lin, D. N. C. 2008, ApJ, 673, 487 [NASA ADS] [CrossRef] [Google Scholar]
- Johansen, A., & Lambrechts, M. 2017, AREP, 45 [Google Scholar]
- Juric, M., & Tremaine, S. 2008, ApJ, 686, 603 [NASA ADS] [CrossRef] [Google Scholar]
- Kolecki, J. R., & Wang, J. 2022, AJ, 164, 87 [NASA ADS] [CrossRef] [Google Scholar]
- Lambrechts, M., & Johansen, A. 2012, A&A, 544, A32 [NASA ADS] [CrossRef] [EDP Sciences] [Google Scholar]
- Lambrechts, M., Johansen, A., & Morbidelli, A. 2014, A&A, 572, A35 [NASA ADS] [CrossRef] [EDP Sciences] [Google Scholar]
- Line, M. R., Brogi, M., Bean, J. L., et al. 2021, Nature, 598, 580 [NASA ADS] [CrossRef] [Google Scholar]
- Lynden-Bell, D., & Pringle, J. E. 1974, MNRAS, 168, 603 [Google Scholar]
- MacDonald, R. J., & Madhusudhan, N. 2017, MNRAS, 469, 1979 [Google Scholar]
- Madhusudhan, N., Bitsch, B., Johansen, A., & Eriksson, L. 2017, MNRAS, 469, 4102 [NASA ADS] [CrossRef] [Google Scholar]
- Mankovich, C. R., & Fuller, J. 2021, Nat. Astron., 5, 1103 [NASA ADS] [CrossRef] [Google Scholar]
- Miguel, Y., Bazot, M., Guillot, T., et al. 2022, A&A, 662, A18 [NASA ADS] [CrossRef] [EDP Sciences] [Google Scholar]
- Mollière, P., van Boekel, R., Dullemond, C., Henning, T., & Mordasini, C. 2015, ApJ, 813, 47 [Google Scholar]
- Mollière, P., Stolker, T., Lacour, S., et al. 2020, A&A, 640, A131 [Google Scholar]
- Mordasini, C., Alibert, Y., & Benz, W. 2009, A&A, 1139 [NASA ADS] [CrossRef] [EDP Sciences] [Google Scholar]
- Morbidelli, A., Lambrechts, M., Jacobson, S. A., & Bitsch, B. 2015, Icarus, 258, 418 [Google Scholar]
- Morbidelli, A., Bitsch, B., Crida, A., et al. 2016, Icarus, 267, 368 [Google Scholar]
- Mulders, G. D., Pascucci, I., Apai, D., & Ciesla, F. J. 2018, AJ, 156, 24 [Google Scholar]
- Ndugu, N., Bitsch, B., & Jurua, E. 2018, MNRAS, 474, 886 [Google Scholar]
- Ndugu, N., Bitsch, B., Morbidelli, A., Crida, A., & Jurua, E. 2021, MNRAS, 501, 2017 [Google Scholar]
- Öberg, K. I., & Wordsworth, R. 2019, AJ, 158, 194 [Google Scholar]
- Öberg, K. I., Murray-Clay, R. A., & Bergin, E. 2011, ApJ, 743 [Google Scholar]
- Paardekooper, S. J., Baruteau, C., & Kley, W. 2011, MNRAS, 410, 293 [NASA ADS] [CrossRef] [Google Scholar]
- Pelletier, S., Benneke, B., Darveau-Bernier, A., et al. 2021, AJ, 162, 73 [NASA ADS] [CrossRef] [Google Scholar]
- Raymond, S. N., Armitage, P. J., & Gorelick, N. 2009, ApJ, 699, L88 [Google Scholar]
- Reggiani, H., Schlaufman, K. C., Healy, B. F., Lothringer, J. D., & Sing, D. K. 2022, AJ, 163, 159 [NASA ADS] [CrossRef] [Google Scholar]
- Schneider, A. D., & Bitsch, B. 2021a, A&A, 654, A71 [Google Scholar]
- Schneider, A. D., & Bitsch, B. 2021b, A&A, 654, A72 [NASA ADS] [CrossRef] [EDP Sciences] [Google Scholar]
- Showman, A. P., & Guillot, T. 2002, A&A, 385, 166 [NASA ADS] [CrossRef] [EDP Sciences] [Google Scholar]
- Sotiriadis, S., Libert, A.-S., Bitsch, B., & Crida, A. 2017, A&A, 598, A70 [NASA ADS] [CrossRef] [EDP Sciences] [Google Scholar]
- Turrini, D., Schisano, E., Fonte, S., et al. 2021, ApJ, 909, 40 [Google Scholar]
- Vazan, A., Helled, R., & Guillot, T. 2018, A&A, 610, A14 [Google Scholar]
- Wahl, S. M., Hubbard, W. B., Militzer, B., et al. 2017, Geophys. Res. Lett., 44, 4649 [CrossRef] [Google Scholar]
- Wakeford, H. R., Sing, D. K., Deming, D., et al. 2018, AJ, 155, 29 [Google Scholar]
- Webb, R. K., Gandhi, S., Brogi, M., et al. 2022, MNRAS, 514, 4160 [CrossRef] [Google Scholar]
- Welbanks, L., Madhusudhan, N., Allard, N. F., et al. 2019, ApJ, 887, L20 [NASA ADS] [CrossRef] [Google Scholar]
Lower viscosities allow for an early gap opening, resulting in an earlier transition to the viscously driven type-II migration regime.
Migration across the water evaporation front does not immediately imply an efficient accretion of water vapor because the pebbles are trapped in the pressure bump exterior to the planet and they can only evaporate once the planet migrated far enough so that the pebbles in the pressure bump can evaporate.
Other planets can also influence the water abundance in the disk, see Bitsch et al. (2021) and Schneider & Bitsch (2021a).
This would also enhance the refractory content of giant planet atmospheres, leaving observable signatures (Schneider & Bitsch 2021b).
All Tables
All Figures
|
Fig. 1 Growth tracks of planets starting at different orbital positions in disks with different viscosities (marked by different symbols). The solid lines mark solid accretion, while the dashed lines mark gas accretion. The dots mark the final masses of WASP-77A b (orange) and τ Boötis b (blue). The evaporation lines for different species are shown for α = 5 × 10⁻⁴ and their distance to the host star increases with increasing α parameter, but they do not evolve in time in our model for simplicity. We note that the growth of the τ Boötis b analogs are a continuation of the growths of the planets resembling WASP-77A b, indicated by a change in color for the corresponding growth tracks. The planetary growth is then stopped once the mass of WASP-77A b or τ Boötis b is reached. |
| In the text | |
|
Fig. 2 Atmospheric abundances of volatiles normed to solar for the different planets shown in Fig. 1 at the end of their evolution. The initial planetary position increases from top to bottom. The colors mark the different planets, while the different symbols mark the different levels of viscosity. The orange bands mark the measured atmospheric abundances of WASP-77A b (Line et al. 2021), while the blue band marks the constraints for τ Boötis b, where H2O/H is less than 10–2 (Pelletier et al. 2021), as indicated by the blue arrow. The slightly subsolar water measurements of Webb et al. (2022) are marked with the horizontal blue bar. Some of our simulations feature water abundances below 10–2 and are thus not shown in the figure. Please note the different scale for C/O. |
| In the text | |
|
Fig. 3 Atmospheric C/O, O/H, and C/H of planets forming in disks with different α viscosity at different initial positions after 3 Myr of evolution. The dark regions correspond to planets that have not reached masses above 100 Earth masses. We note that planets growing in disks with higher viscosities migrate farther and are generally more massive than planets growing in disks with lower viscosities (Schneider & Bitsch 2021a). |
| In the text | |
|
Fig. B.1 Atmospheric C/H, O/H, N/H, C/O, and H2O/H content of planets forming at 3.5, 10, and 30 au in disks with different viscosities. Symbols and color codings are the same as in Fig. 2. We do not take the evaporation of inward drifting pebbles into account, in contrast to Fig. 2, resulting in typically subsolar abundances. |
| In the text | |
Current usage metrics show cumulative count of Article Views (full-text article views including HTML views, PDF and ePub downloads, according to the available data) and Abstracts Views on Vision4Press platform.
Data correspond to usage on the plateform after 2015. The current usage metrics is available 48-96 hours after online publication and is updated daily on week days.
Initial download of the metrics may take a while.