Fig. 1

Download original image
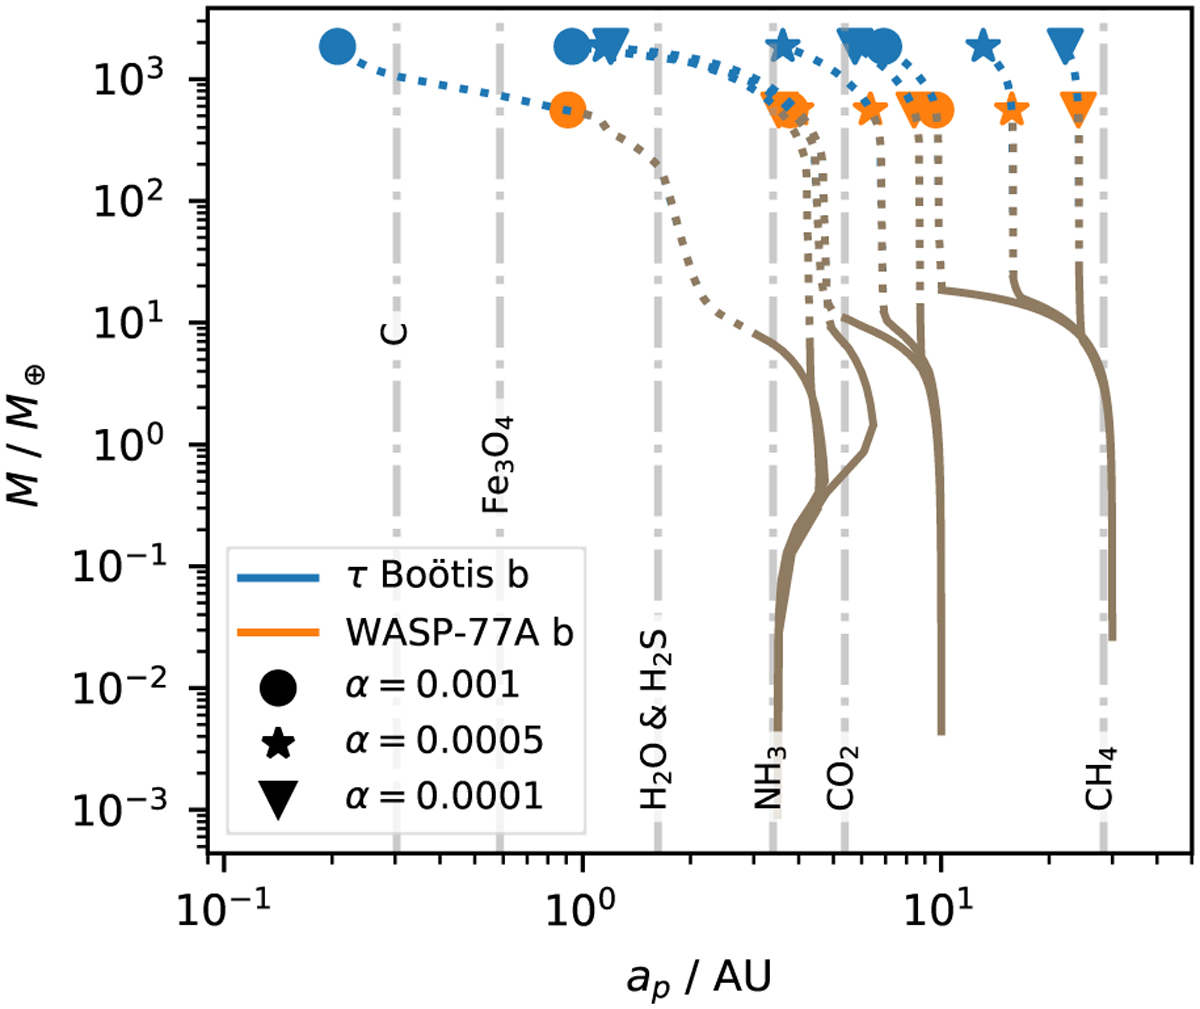
Growth tracks of planets starting at different orbital positions in disks with different viscosities (marked by different symbols). The solid lines mark solid accretion, while the dashed lines mark gas accretion. The dots mark the final masses of WASP-77A b (orange) and τ Boötis b (blue). The evaporation lines for different species are shown for α = 5 × 10⁻⁴ and their distance to the host star increases with increasing α parameter, but they do not evolve in time in our model for simplicity. We note that the growth of the τ Boötis b analogs are a continuation of the growths of the planets resembling WASP-77A b, indicated by a change in color for the corresponding growth tracks. The planetary growth is then stopped once the mass of WASP-77A b or τ Boötis b is reached.
Current usage metrics show cumulative count of Article Views (full-text article views including HTML views, PDF and ePub downloads, according to the available data) and Abstracts Views on Vision4Press platform.
Data correspond to usage on the plateform after 2015. The current usage metrics is available 48-96 hours after online publication and is updated daily on week days.
Initial download of the metrics may take a while.


