Fig. 2
Download original image
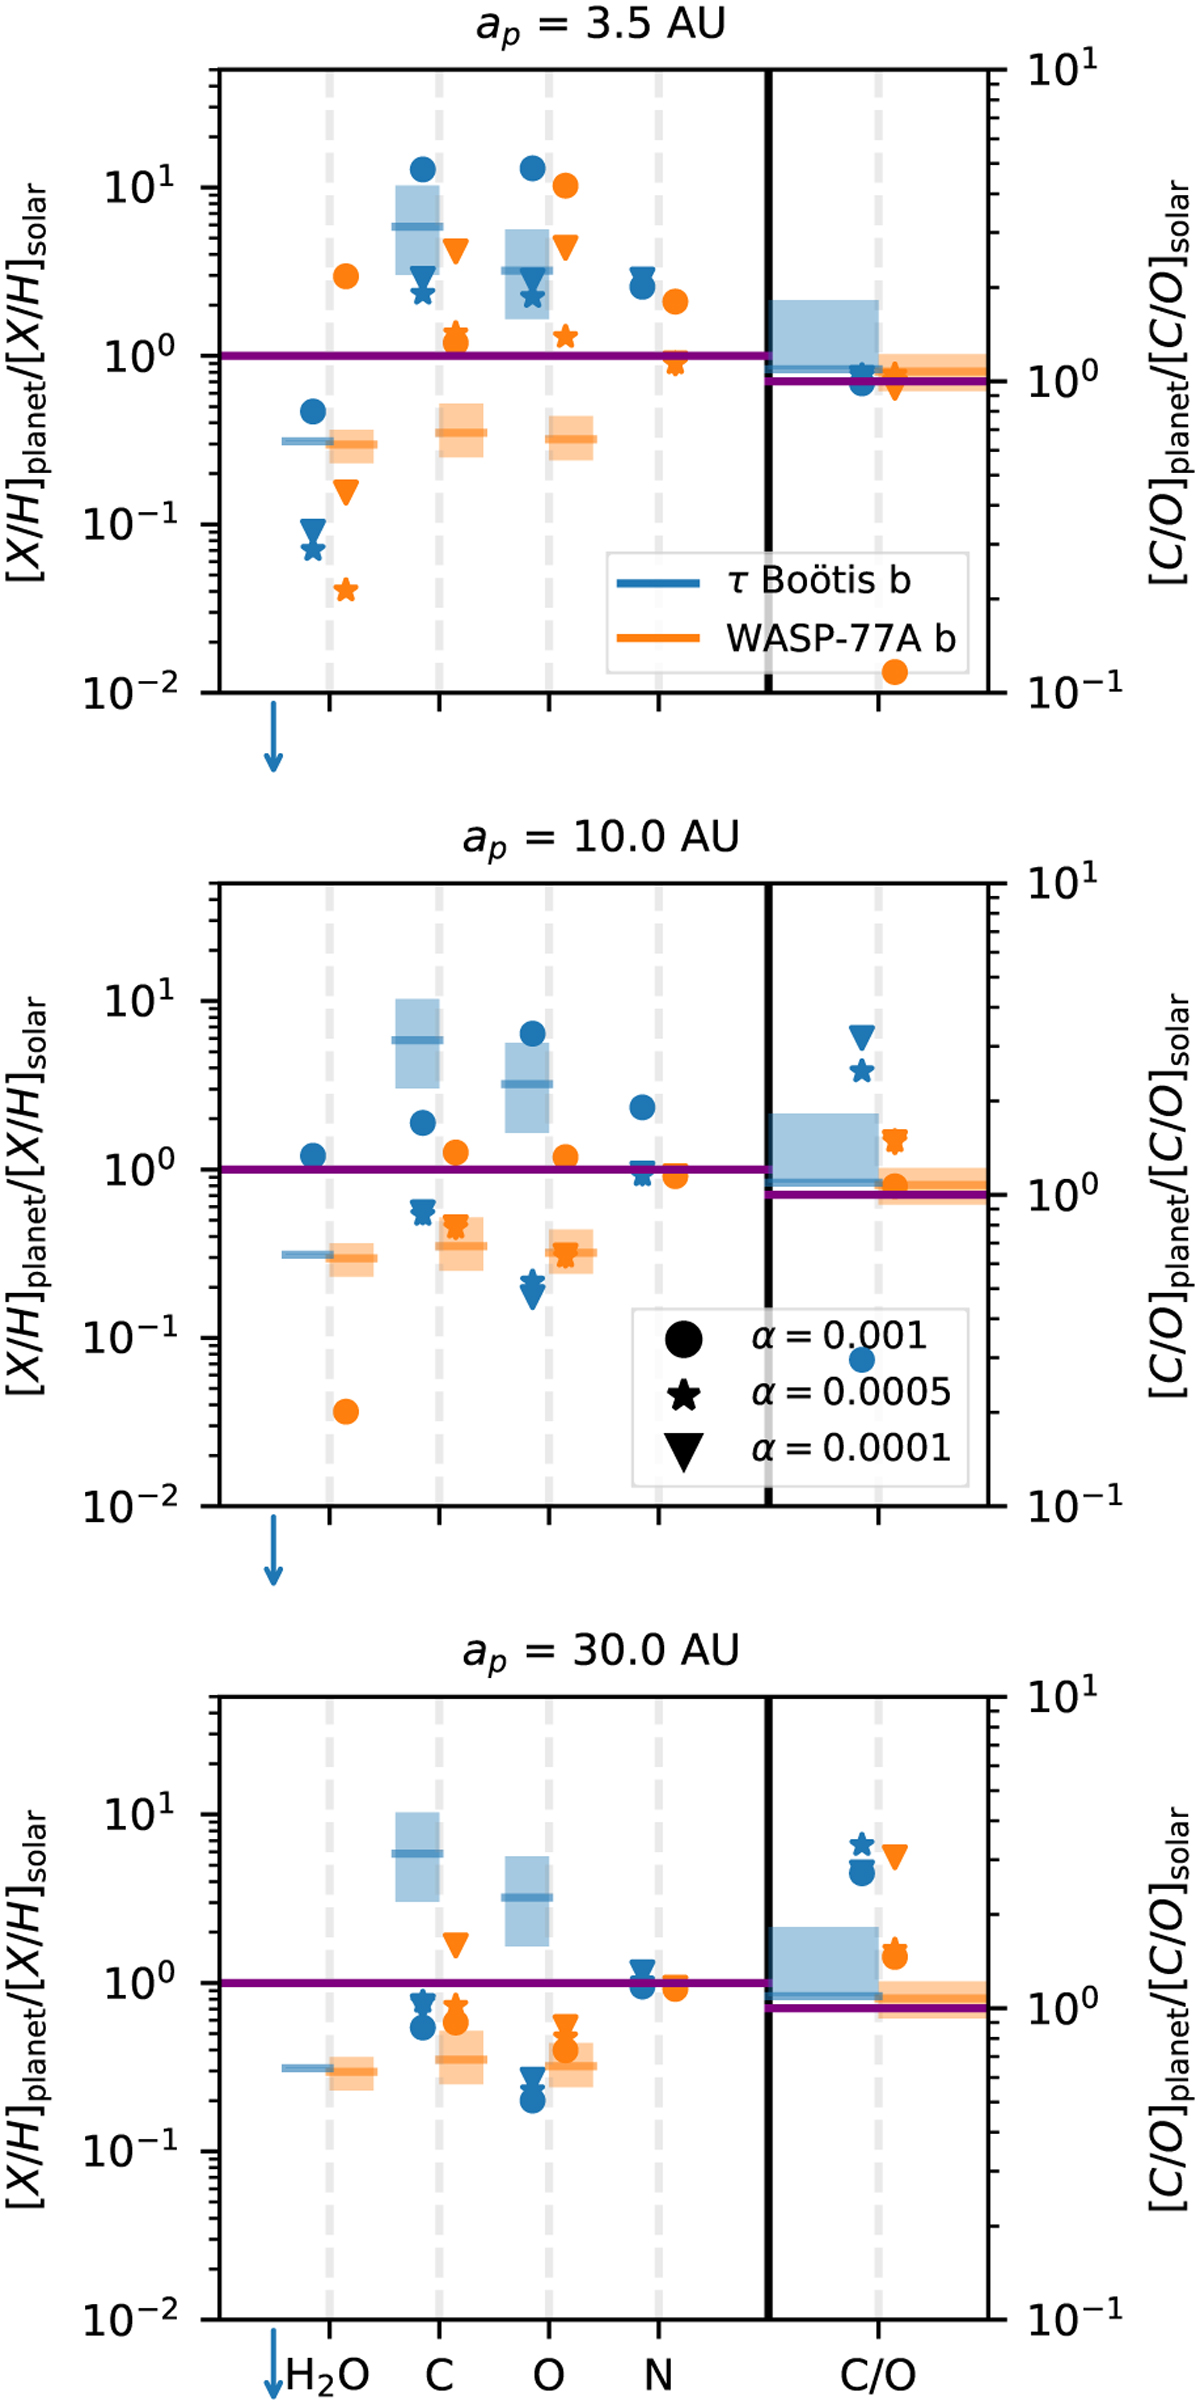
Atmospheric abundances of volatiles normed to solar for the different planets shown in Fig. 1 at the end of their evolution. The initial planetary position increases from top to bottom. The colors mark the different planets, while the different symbols mark the different levels of viscosity. The orange bands mark the measured atmospheric abundances of WASP-77A b (Line et al. 2021), while the blue band marks the constraints for τ Boötis b, where H2O/H is less than 10–2 (Pelletier et al. 2021), as indicated by the blue arrow. The slightly subsolar water measurements of Webb et al. (2022) are marked with the horizontal blue bar. Some of our simulations feature water abundances below 10–2 and are thus not shown in the figure. Please note the different scale for C/O.
Current usage metrics show cumulative count of Article Views (full-text article views including HTML views, PDF and ePub downloads, according to the available data) and Abstracts Views on Vision4Press platform.
Data correspond to usage on the plateform after 2015. The current usage metrics is available 48-96 hours after online publication and is updated daily on week days.
Initial download of the metrics may take a while.