Open Access
Fig. 9.
Download original image
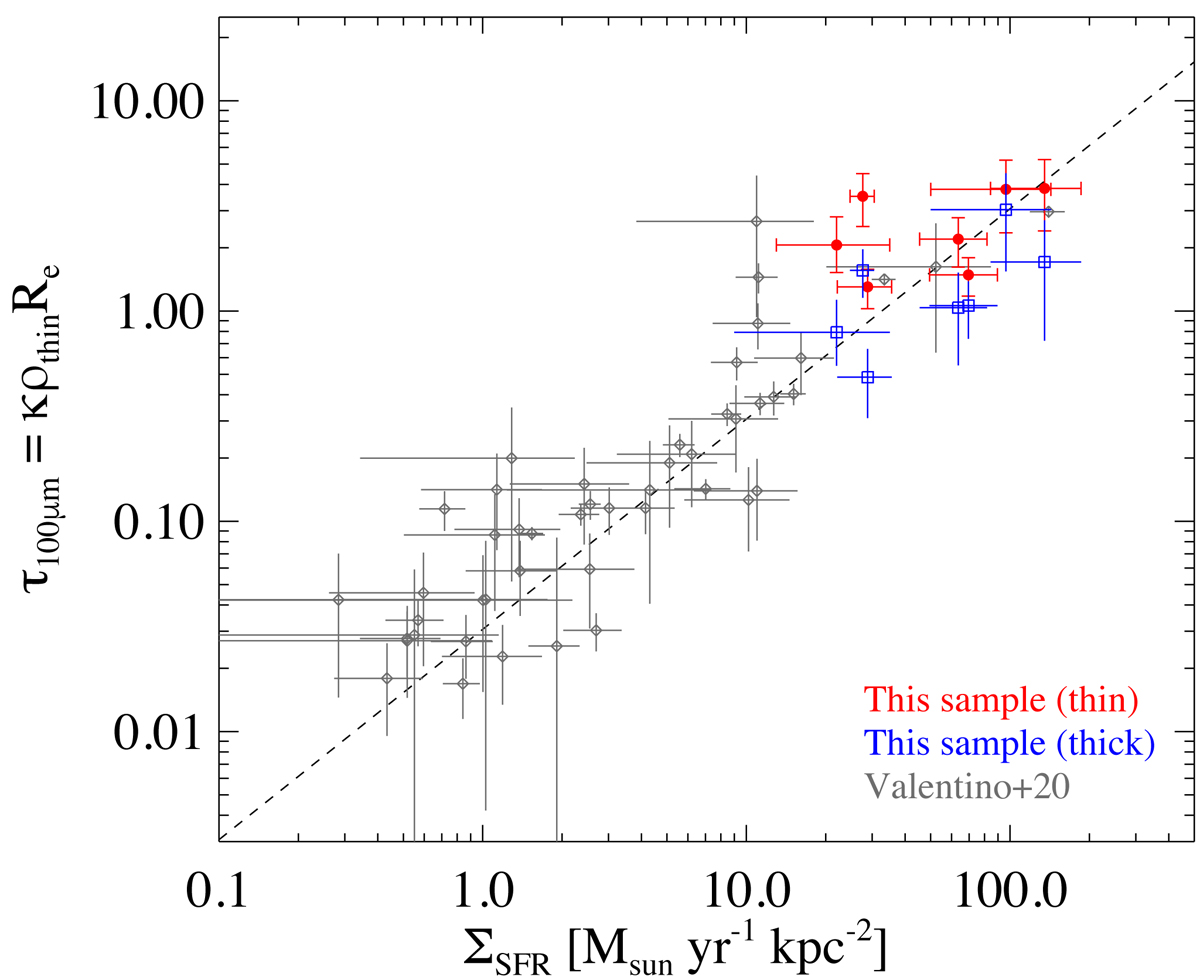
Dust opacity τ100 μm vs. SFR surface density ΣSFR. The dashed line shows a fit to the data points under the optically thin assumption, i.e., τ100 μm = 3.1 × 10⁻²ΣSFR. In both the optically thin and thick models, our sample shows high dust opacity at FIR wavelengths.
Current usage metrics show cumulative count of Article Views (full-text article views including HTML views, PDF and ePub downloads, according to the available data) and Abstracts Views on Vision4Press platform.
Data correspond to usage on the plateform after 2015. The current usage metrics is available 48-96 hours after online publication and is updated daily on week days.
Initial download of the metrics may take a while.