Fig. 8.
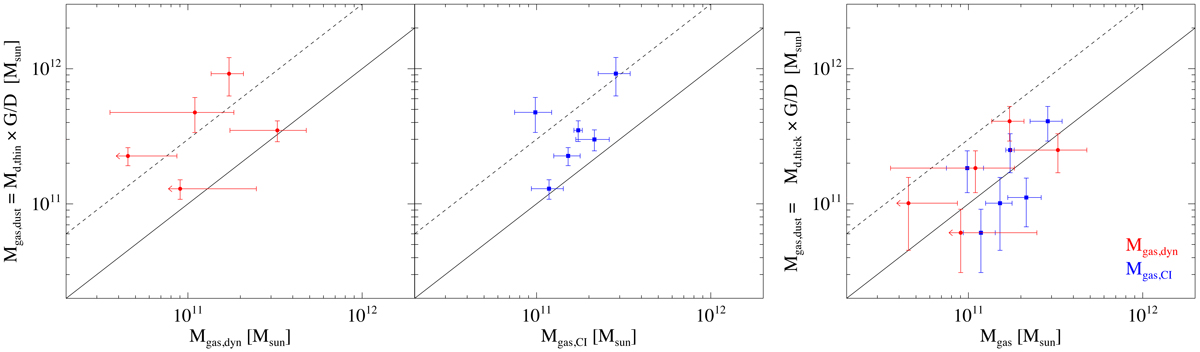
Download original image
Gas mass derived from dust mass vs. gas mass for this sample and the z = 3.62 source in Jin et al. (2019). Left panels: comparison of gas mass from optically thin dust mass to gas mass from dynamical and [CI] estimations (Mgas, dyn, Mgas, CI), respectively. Right panel: gas mass derived from optically thick dust to Mgas, dyn (red dots) and Mgas, CI (blue squares). Solid line shows the 1:1 identity relation and the dashed line is three times the identity line. Optically thin dust models significantly and systematically overestimate the dust mass of galaxies in this work, indicating that they have optically thick dust.
Current usage metrics show cumulative count of Article Views (full-text article views including HTML views, PDF and ePub downloads, according to the available data) and Abstracts Views on Vision4Press platform.
Data correspond to usage on the plateform after 2015. The current usage metrics is available 48-96 hours after online publication and is updated daily on week days.
Initial download of the metrics may take a while.