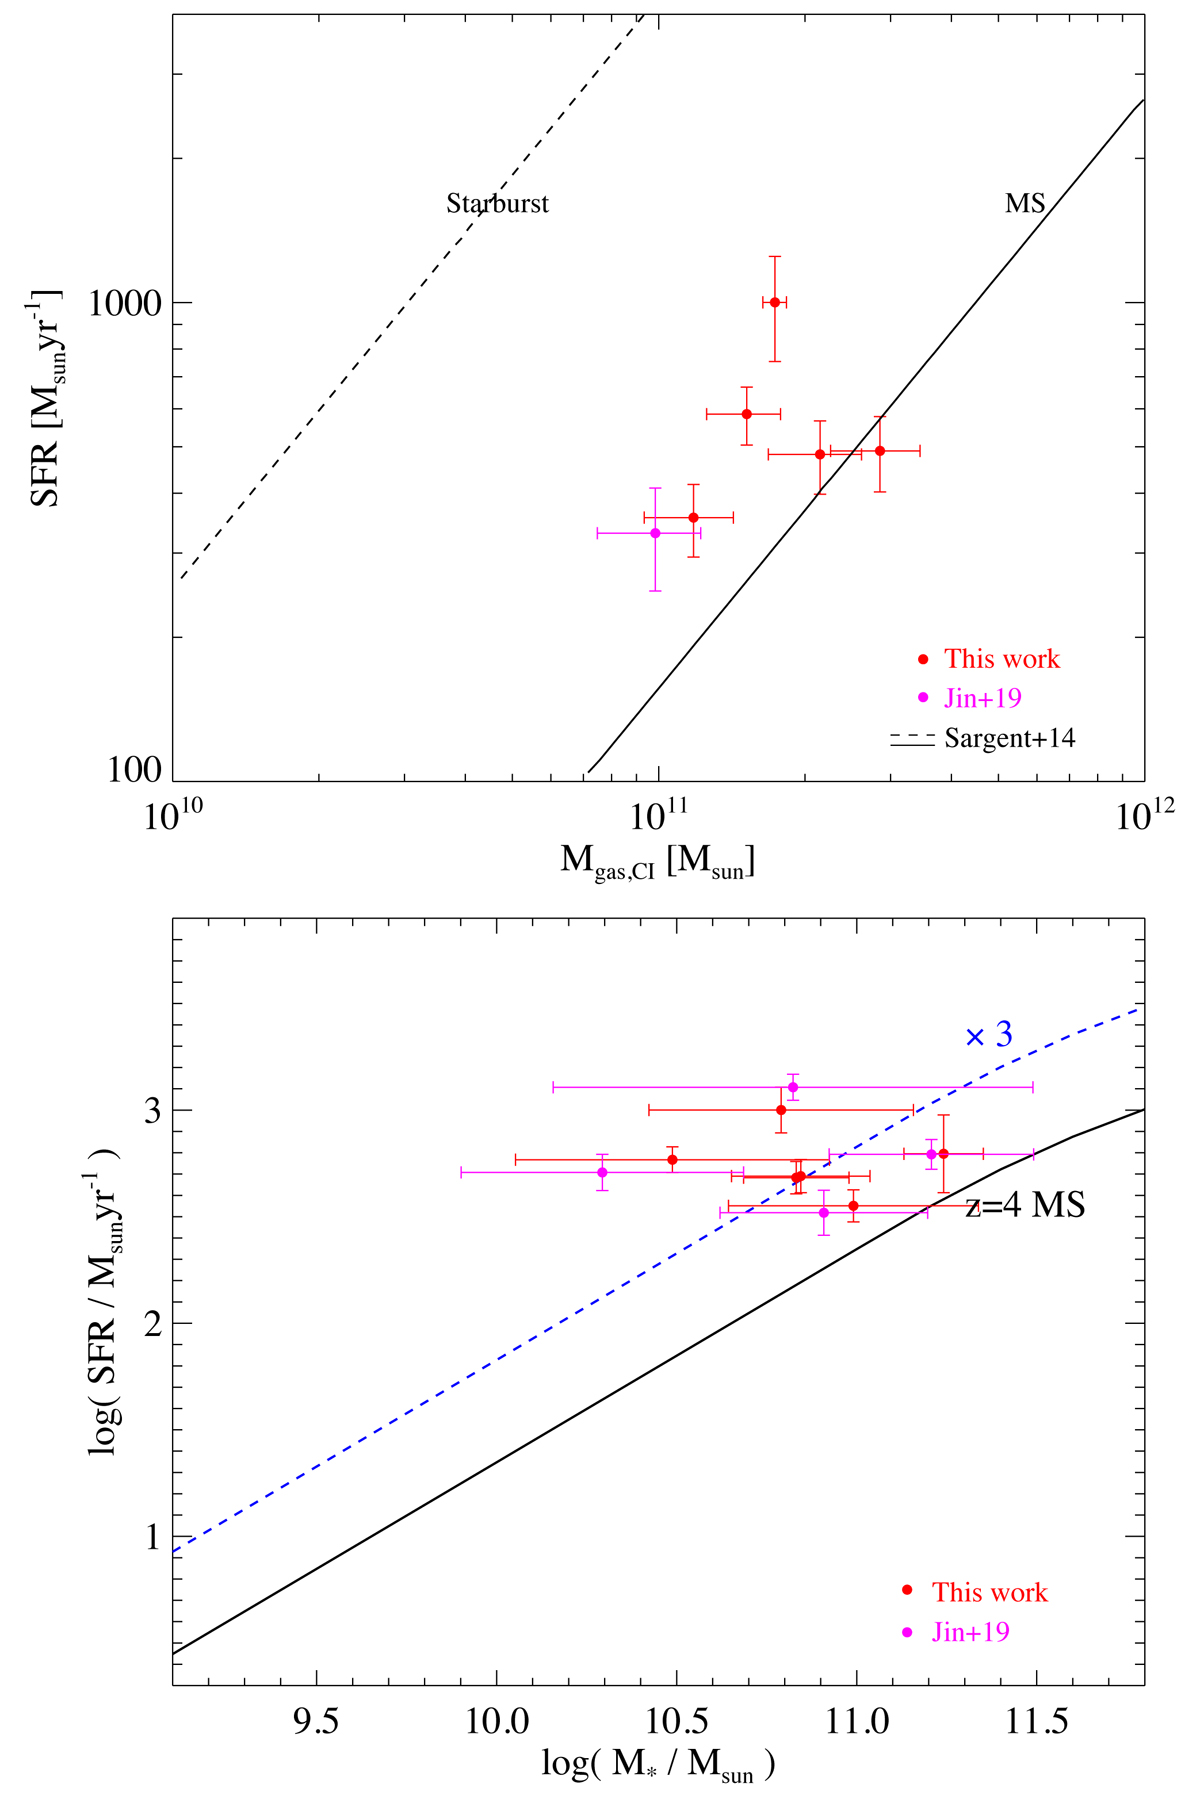
Fig. 7.
Download original image
Top: SFR vs. molecular gas mass derived from CI. Solid and dashed lines mark the relations for MS and starbursting galaxies at z ∼ 2 in Sargent et al. (2014). Bottom: SFR vs stellar mass. Black line shows the MS at z = 4 from Schreiber et al. (2015), and the blue dashed line marks three times the MS. Our sample galaxies show high SFEs with respect to MS galaxies and appear to be starbursts on the SFR–M* diagram.
Current usage metrics show cumulative count of Article Views (full-text article views including HTML views, PDF and ePub downloads, according to the available data) and Abstracts Views on Vision4Press platform.
Data correspond to usage on the plateform after 2015. The current usage metrics is available 48-96 hours after online publication and is updated daily on week days.
Initial download of the metrics may take a while.