Fig. 6.
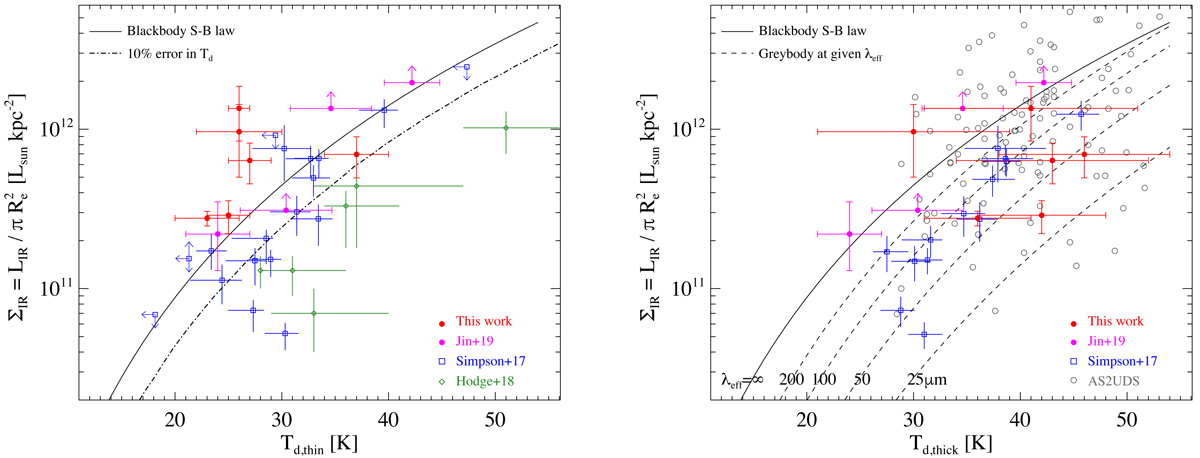
Download original image
IR luminosity surface density vs. dust temperature for dusty galaxies in the literature and this work. Left and right panels show dust temperatures from optically thin and thick models, respectively. Blue squares mark data points from Simpson et al. (2017); red diamonds show the ALESS sample in Hodge et al. (2019). The AS2UDS sources (Stach et al. 2019) are shown in open circles, which are calculated using results from Gullberg et al. (2019) and Dudzevičiūtė (2020). The Stefan-Boltzmann (S-B) law is shown as a solid curve, representing the expected limit for a black body. The dot-dashed curve marks the 10% systematic bias of Td, thin, where above the curve Td would be underestimated more than 10% by thin models. Dashed curves show the expected relations for general models with different λeff as labeled. This figure provides a diagnostic method identifying optically thick dust.
Current usage metrics show cumulative count of Article Views (full-text article views including HTML views, PDF and ePub downloads, according to the available data) and Abstracts Views on Vision4Press platform.
Data correspond to usage on the plateform after 2015. The current usage metrics is available 48-96 hours after online publication and is updated daily on week days.
Initial download of the metrics may take a while.