Fig. 5.
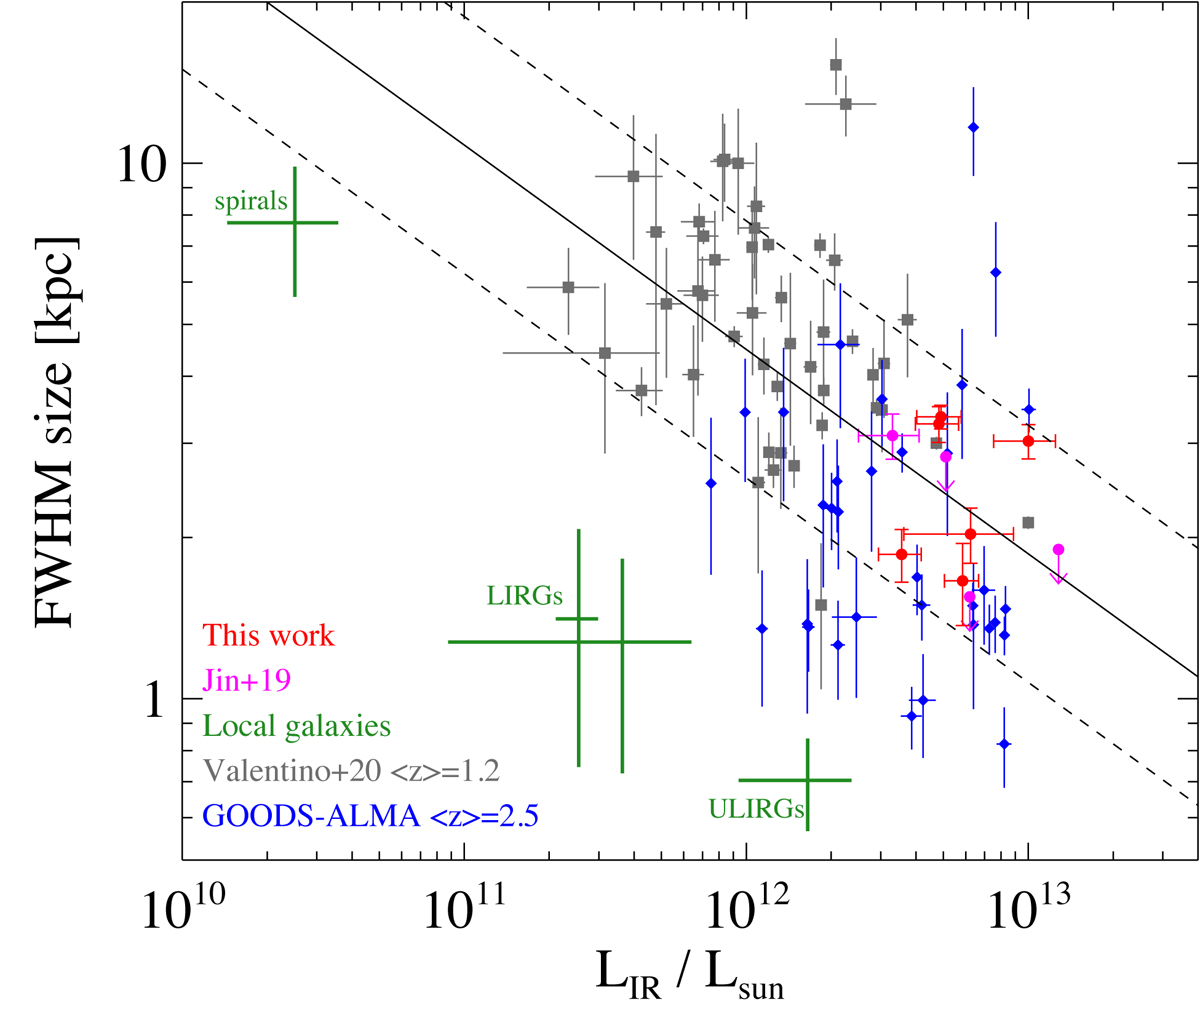
Download original image
Size of dust continuum vs. IR luminosity for this sample and data in the literature. Grey diamonds represent MS galaxies at z ∼ 1.2 in Valentino et al. (2020b) and blue squares mark the GOODS-ALMA sample (Franco et al. 2020; Gómez-Guijarro et al. 2022b). Green crosses show the medians of four local galaxy samples (Spirals: Bolatto et al. 2017; LIRGs: Bellocchi et al. 2022; ULIRGs: Pereira-Santaella et al. 2021); the dispersion of each sample is indicated by an error bar. The solid line shows the best fit to the high-z data points, and the dashed lines mark the 1σ scatter. Both local and high-z galaxies show an anti-correlation between dust continuum size and infrared luminosity.
Current usage metrics show cumulative count of Article Views (full-text article views including HTML views, PDF and ePub downloads, according to the available data) and Abstracts Views on Vision4Press platform.
Data correspond to usage on the plateform after 2015. The current usage metrics is available 48-96 hours after online publication and is updated daily on week days.
Initial download of the metrics may take a while.