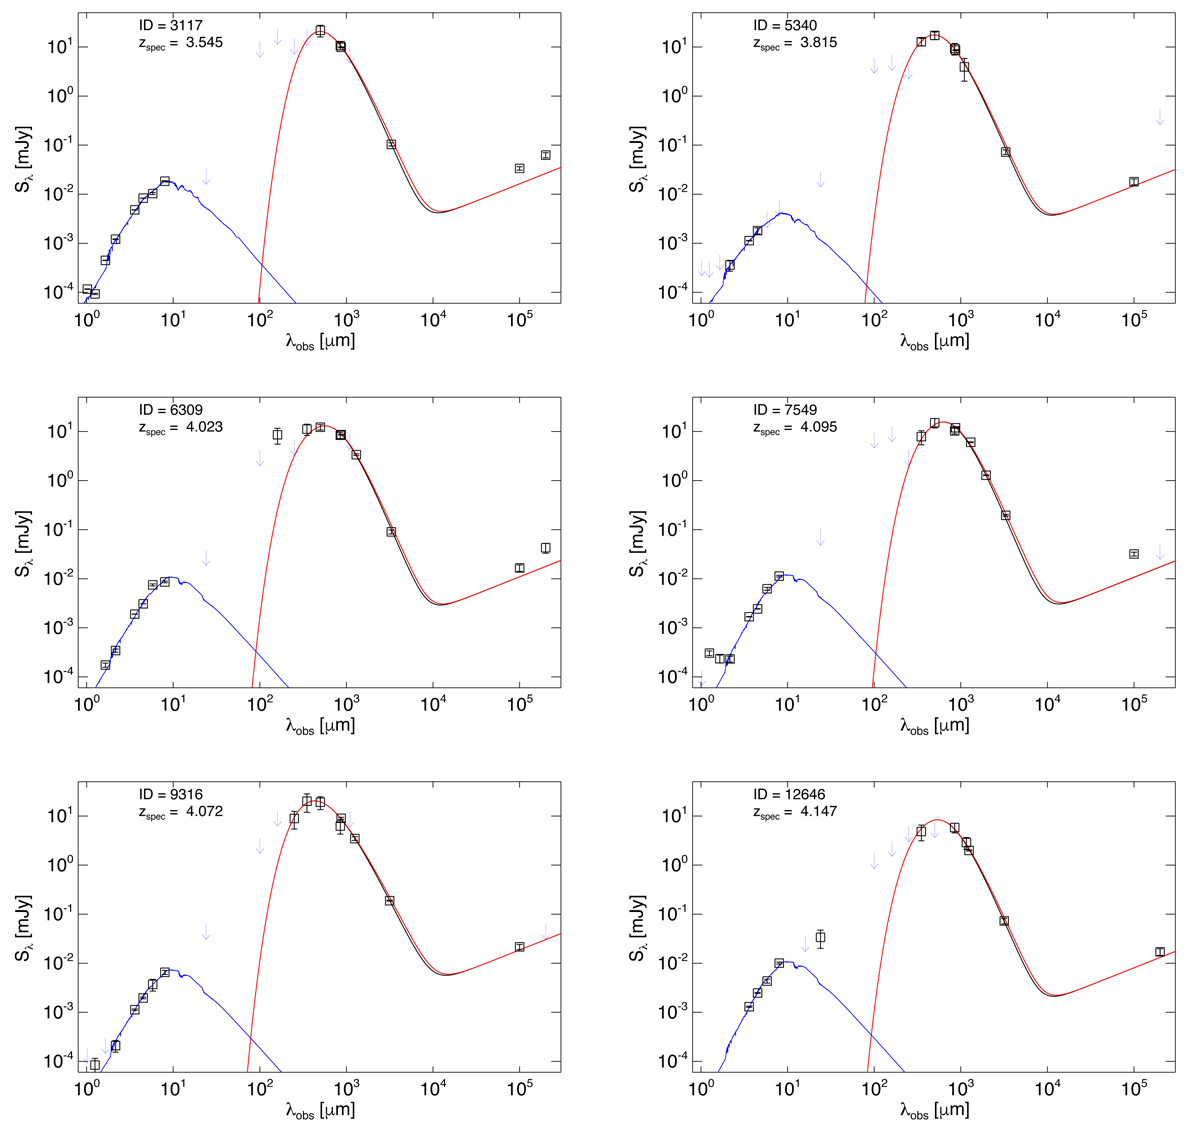
Fig. 3.
Download original image
SEDs of galaxies in this study. Photometry is from the super-deblended catalogs (Jin et al. 2018; Liu et al. 2018) and ALMA and NOEMA measurements. The dust SEDs are fitted with optically thick MBB models accounting for CMB impact on the continuum (da Cunha et al. 2013). The black (red) curve shows the best fit to the observed SED accounting (not accounting) for CMB. The blue curve marks the stellar component. We note that the radio data are not included in the fitting; we extrapolated a radio component to the dust SEDs using the IR–radio correlation from Delvecchio et al. (2021).
Current usage metrics show cumulative count of Article Views (full-text article views including HTML views, PDF and ePub downloads, according to the available data) and Abstracts Views on Vision4Press platform.
Data correspond to usage on the plateform after 2015. The current usage metrics is available 48-96 hours after online publication and is updated daily on week days.
Initial download of the metrics may take a while.