Fig. 2
Download original image
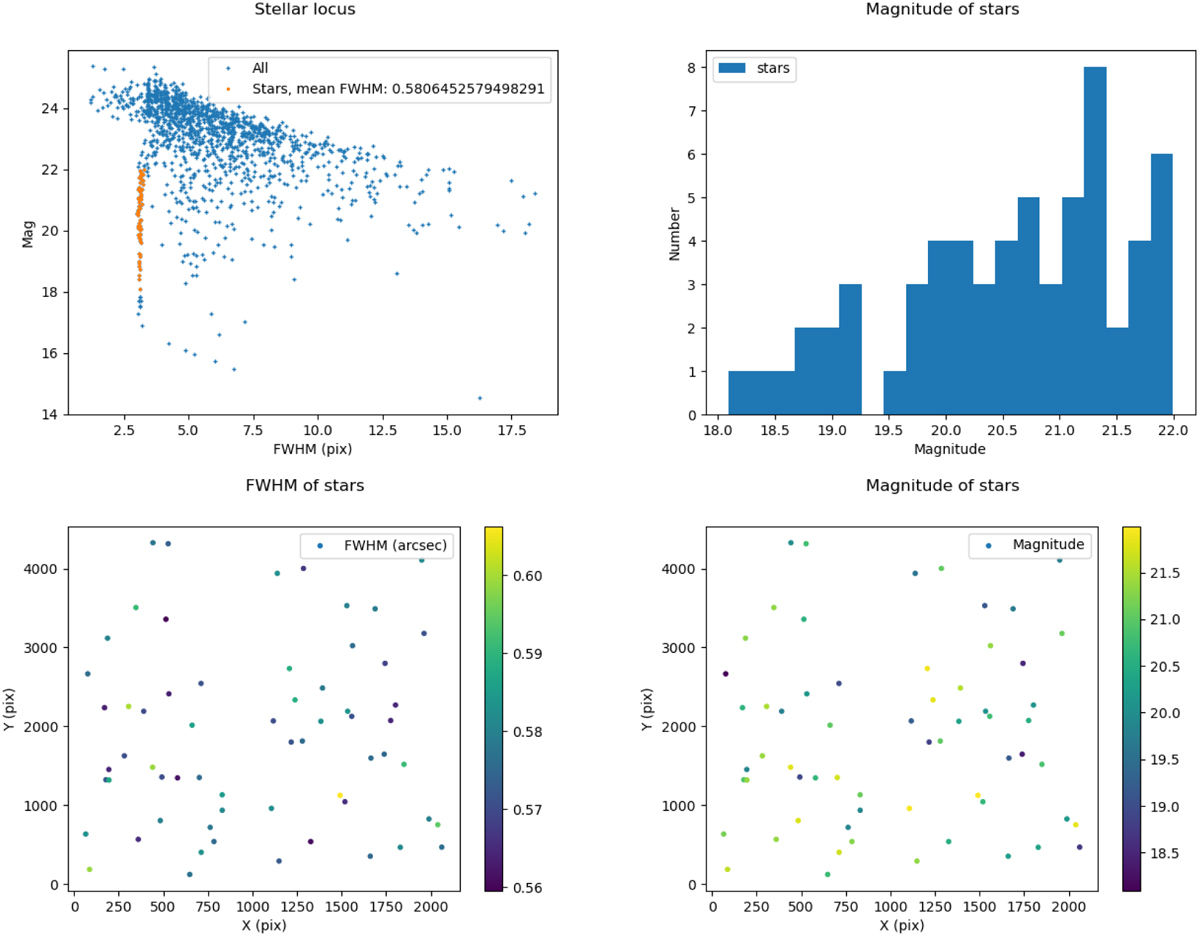
Example of a refined star selection obtained with the setools module on a patch of UNIONS data. All of the plots shown are generated automatically by ShapePipe. Top left: Stellar locus (orange points) in the size-magnitude plane. Top right: histogram of the magnitude of the objects. Bottom left: size of objects in the field. Bottom right: magnitude of objects in the field.
Current usage metrics show cumulative count of Article Views (full-text article views including HTML views, PDF and ePub downloads, according to the available data) and Abstracts Views on Vision4Press platform.
Data correspond to usage on the plateform after 2015. The current usage metrics is available 48-96 hours after online publication and is updated daily on week days.
Initial download of the metrics may take a while.