Fig. 9.
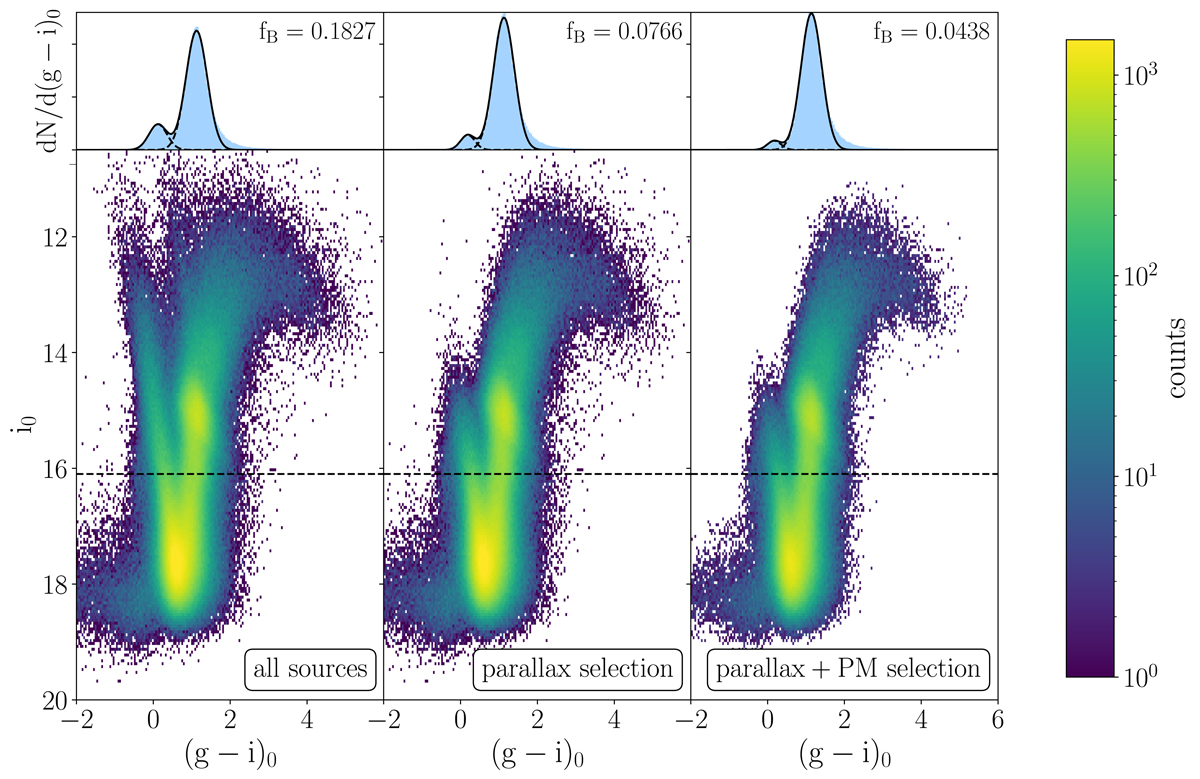
Download original image
Density plots illustrating the parallax and proper motion cleaning of the dereddend CMD for stars in Baade’s window. Left: all sources with reliable BDBS photometry and Gaia EDR3 astrometry. Middle: same as middle panel in Fig. 4, ϖ-background sources surviving the Gaia EDR3 parallax cuts. Right: subset of the ∼3.3 × 10⁵ sources with Gaia EDR3 proper motions consistent with a bulge membership, according to the GMM. The blue histograms above the CMDs represent the corresponding normalized distributions of (g − i)0 for stars brighter than i0, max − 3σi = 16.1 (shown as a horizontal dashed line in all three plots). The dashed curves correspond to the two fitted Gaussian distributions, and the black curve to their sum. The corresponding value of fB (the ratio between blue and red stars) is reported in each panel.
Current usage metrics show cumulative count of Article Views (full-text article views including HTML views, PDF and ePub downloads, according to the available data) and Abstracts Views on Vision4Press platform.
Data correspond to usage on the plateform after 2015. The current usage metrics is available 48-96 hours after online publication and is updated daily on week days.
Initial download of the metrics may take a while.