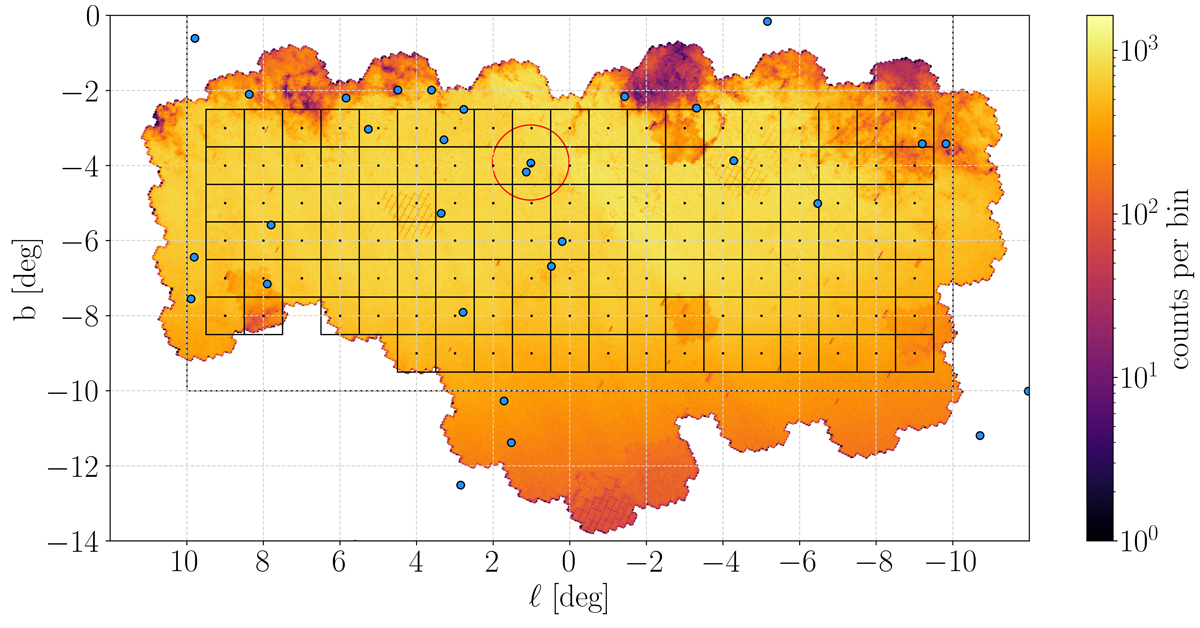
Fig. 1.
Download original image
Logarithmic density, in Galactic coordinates, of all the sources from the BDBS/Gaia EDR3 matched catalogue. The colour is proportional to the number of stars in each bin. The bins have sizes of 2.26′×2.26′. The dashed box marks the region where we can use the extinction map derived by Simion et al. (2017). The red circle shows the location of the field centred on Baade’s window with a radius of 1°, analysed in Sect. 3. The black squares show the bulge fields examined in Sect. 4, each covering an area of 1 deg2. The blue-filled circles correspond to the known clusters in the field, taken from the catalogue of Harris (1996, 2010 edition).
Current usage metrics show cumulative count of Article Views (full-text article views including HTML views, PDF and ePub downloads, according to the available data) and Abstracts Views on Vision4Press platform.
Data correspond to usage on the plateform after 2015. The current usage metrics is available 48-96 hours after online publication and is updated daily on week days.
Initial download of the metrics may take a while.