| Issue |
A&A
Volume 664, August 2022
|
|
|---|---|---|
| Article Number | A7 | |
| Number of page(s) | 11 | |
| Section | Stellar structure and evolution | |
| DOI | https://doi.org/10.1051/0004-6361/202243727 | |
| Published online | 04 August 2022 | |
Magnetically gated accretion model: Application to short bursts in the intermediate polar V1223 Sgr
1
Observatoire Astronomique de Strasbourg, CNRS UMR 7550, 67000 Strasbourg, France
e-mail: This email address is being protected from spambots. You need JavaScript enabled to view it.
2
Institut d’Astrophysique de Paris, UMR 7095 CNRS, UPMC Université Paris 6, 98bis Bd Arago, 75014 Paris, France
3
Nicolaus Copernicus Astronomical Center, Polish Academy of Sciences, Bartycka 18, 00-716 Warsaw, Poland
4
Department of Physics, University of Nevada, Reno, NV 89557, USA
Received:
7
April
2022
Accepted:
22
May
2022
Abstract
Context. Some intermediate polars (IPs) show outbursts that are much shorter than those observed in normal dwarf novae, and their origin remains unclear.
Aims. We examine the case of V1223 Sgr, an intermediate polar that showed a short outburst in 1984, and compare the outburst characteristics with the predictions of the magnetospheric gating model.
Methods. We extracted outburst profiles from the American Association of Variable Star Observers (AAVSO) archival data. We used our code to compute the time-dependent evolution of an accretion disc truncated by the white dwarf magnetic field, using a simple description of the interaction between the disc and the magnetic field, as in D’Angelo & Spruit (2010, MNRAS, 406, 1208).
Results. We find that V1223 Sgr underwent a series of short outbursts, with a rise lasting for typically two to three hours, and a slightly longer decay. When applied to IPs, the model by D’Angelo & Spruit (2010, MNRAS, 406, 1208) accounts well for the observed outburst duration and intensity. However, we confirm that the model outcome depends sensitively on the assumptions of the rather poorly constrained model. We also searched the AAVSO database for short outbursts in other IPs, identifying individual short outbursts in FO Aqr, TV Col, NY Lup, and EI UMa, but no series such as those observed in V1223 Sgr. We also found a superoutburst, followed by a reflare in CTCV J2056−3014.
Conclusions. Although the magnetic–gating accretion instability model is clearly responsible for the series of V1223 Sgr short outbursts and most probably for similar events in other IPs, the model describing this process needs improvement, in particular concerning the interaction between the magnetic field of the white dwarf and the accretion disc. This difficult task might benefit from further comparison of the model outcome with additional observations that show good time coverage and time resolution.
Key words: accretion / accretion disks / stars: dwarf novae / instabilities
© J.-M. Hameury et al. 2022
 Open Access article, published by EDP Sciences, under the terms of the Creative Commons Attribution License (https://creativecommons.org/licenses/by/4.0), which permits unrestricted use, distribution, and reproduction in any medium, provided the original work is properly cited.
This article is published in open access under the Subscribe-to-Open model. This email address is being protected from spambots. You need JavaScript enabled to view it. to support open access publication.
1. Introduction
Dwarf nova (DN) eruptions are sudden brightenings by typically a few magnitudes that are observed in some classes of cataclysmic variables (CVs). They usually last for a few days, and recur on timescales of weeks (see e.g., Warner 2003, for a detailed review of these objects). It has long since been known and is now very clear (Dubus et al. 2018) that these outbursts are due to a thermal–viscous instability of the accretion disc (see Lasota 2001; Hameury 2020, for reviews). The instability occurs when, somewhere in the disc, the midplane temperature is in the range of 10 000–20 000 K, such that hydrogen is partially ionised and the opacities are strongly dependent on temperature. During low states, the disc is cold and neutral everywhere, while the mass-accretion rate onto the white dwarf is small; the disc mass builds up and the central temperature increases, eventually reaching the critical value at which ionisation becomes important and the instability sets in. Heat fronts propagate, bringing the accretion disc into a hot state in which the accretion rate is higher than the rate at which the secondary transfers mass to the disc. The disc then empties and cools down until a point where it cannot be maintained in a hot state; a cooling wave starts from the disc outer edge and crosses the disc, bringing it to quiescence.
Intermediate polars (IPs) are CVs in which the white dwarf magnetic field is strong enough to prevent the accretion disc from reaching the surface of the white dwarf, or from even forming at all, but not strong enough to force corotation of the white dwarf with the orbit. If a disc exists, the disc instability model (DIM) can still apply, and IPs can also exhibit dwarf nova outbursts, as discussed in Hameury & Lasota (2017a); typical dwarf nova outbursts have been observed in IPs, such as GK Per. However, some IPs show short outbursts (a few hours) that cannot be explained by the DIM. Until recently, the best documented example was TV Col (Szkody & Mateo 1984; Hellier & Buckley 1993; Hudec et al. 2005) which shows outbursts lasting for about six hours. Short outbursts have also been detected in IPs such as V1223 Sgr (van Amerongen & van Paradijs 1989) or CXOGBS J174954.5−294335 (Johnson et al. 2017), but due to insufficient time coverage, only upper limits on the outburst duration could be obtained. The situation changed with the observation by TESS of V1025 Cen, which showed a rapid succession (recurrence time ranging between 1 and 3 days) of short (less than six hours) outbursts (Littlefield et al. 2022). Covington et al. (2022) also reported the detection of many short outbursts in V1223 Sgr, and we explore these here in detail. CVs not classified as magnetic have also shown short outbursts; MV Lyr experienced a series of 30-min outbursts every two hours (Scaringi et al. 2017). TW Pic (Scaringi et al. 2022a) showed abrupt drops by factors of up to 3.5 on timescales as short as 30 min; in the low mode, it displayed bursts with a recurrence time of 1.2–2.4 h. In both cases, a weak magnetic field was invoked to account for the observations.
Despite early claims that the truncation of the accretion disc by the white dwarf magnetic field results in shorter bursts than in non-magnetic CVs, and that outbursts lasting for a few hours in CVs could be explained by the DIM (Schwarz et al. 1988), it was soon realised that this cannot be the case. Using the DIM, Angelini & Verbunt (1989) did not see outbursts lasting less than one day, even though the authors used a viscosity parameter α in the hot state as high as unity. It has also been suggested that these short outbursts are due to a mass transfer instability occurring in the secondary (see, e.g. Angelini & Verbunt 1989; Hellier & Buckley 1993). However, calculations by Hameury & Lasota (2017a) using reasonable values for the viscosity parameter in the disc showed that this would require the disc to remain in the cold state and would necessitate large changes in the mass-transfer rate in order to avoid light fluctuations on the viscous timescale, which is longer than the outburst duration. The outburst would then solely be due to an increase in the bright spot luminosity.
It was recently proposed that short outbursts are ‘micronovae’ due to localised thermonuclear explosions at the surface of the white dwarf that result from confinement of the accreted material by the magnetic field (Scaringi et al. 2022b,c). However, this relies on the hypothesis that the magnetic field is rigidly anchored at the surface of the white dwarf; Hameury & Lasota (1985) showed that, if this hypothesis holds, the magnetic field can indeed confine the accreted material even if the magnetic pressure is much less than the gas pressure. However, these latter authors noted that, in contrast with the neutron star case, this is rather uncertain. In any case, whereas such a model could account for isolated outbursts observed in TV Col for example, it cannot explain sequences of outbursts recurring on timescales of days or less (Scaringi et al. 2022b).
It was finally proposed by Littlefield et al. (2022) that the rapid succession of short outbursts in V1025 Cen is due to magnetospheric gating, which was initially proposed by Spruit & Taam (1993) to explain the rapid burster phenomenon and later developed by D’Angelo & Spruit (2010; 2011; 2012; hereafter referred to as DS10, DS11, and DS12, respectively). This followed an earlier suggestion by Mhlahlo et al. (2007) that EX Hya outbursts are due to this mechanism, and the proposals by Scaringi et al. (2017, 2022a) that this mechanism is also at play in MV Lyr and TW Pic provided that the white dwarf in these two objects is weakly magnetised, with a magnetic field in the range of 2 × 10⁴–105 G for MV Lyr and less than 106 G in TW Pic.
In Sect. 2 of this paper, we present the characteristics of the outbursts observed in 2020 in V1223 Sgr in detail. In Sect. 3 we present results of a search for short outbursts in other IPs from observations in the database maintained by the American Association of Variable Star Observers (AAVSO). We adapt the magnetospheric gating model to the IPs in Sect. 4, and use it for the first time to calculate the light curves of short outbursts observed in these systems, applying it in particular to the case of V1223 Sgr. Our conclusions are summarised in Sect. 5.
2. Rapid outbursts in V1223 Sgr
V1223 Sgr is an IP with an orbital period of 3.36 h and a spin period of 0.207 h. The primary and secondary masses, as determined from spectral fitting of the X-ray spectrum, are M1 = 0.92 M⊙ and M2 = 0.33 M⊙, respectively (Hayashi et al. 2021), implying an inclination of 53 ± 2°; Hayashi et al. (2021) note that if the inner disc is truncated at the corotation radius, the primary mass should be revised to M1 = 0.97 M⊙, which is significantly larger than a previous determination by Penning (1985) who found that M1 should be in the range of 0.4–0.6 M⊙ and by Shaw et al. (2018) who found M1 = 0.75 M⊙, but in line with determinations by Hayashi & Ishida (2014) and by Beuermann et al. (2004) who obtain M1 = 0.87 and 0.93 M⊙ respectively. In the following, we assume M1 = 0.9 M⊙. The parallax of the source, as determined by Gaia, is 1.72 ± 0.047 mas, which corresponds to a distance of 580 pc (Gaia Collaboration 2018).
The spin period of V1223 Sgr has steadily increased over the past 40 years (Patterson et al. 2020), which comes as a surprise because this source is bright, and would be expected to spin up, as do most other bright IPs. This questions the assumption that V1223 Sgr is in spin equilibrium, spending equal amounts of time spinning up during high states and down during very low states, as noted by Patterson et al. (2020). This makes it difficult to estimate the magnetic moment μ of the primary from the spin period but Norton et al. (2004) suggest μ = 4 × 1032 G cm3 for this source.
The AAVSO light curve shows that V1223 Sgr is most often at a constant magnitude V = 13. Its 1984 outburst (van Amerongen & van Paradijs 1989) was not detected by the AAVSO, but another short, presumably isolated outburst was detected on June 16, 2014; it lasted for at least 10 h, and reached a magnitude V = 11.2. Its profile is shown in Fig. 1, where we plot the visual CV and CR + 0.3, CR being the unfiltered red magnitude with Bessel R zeropoint. We added 0.3 to CR; when simultaneous CV and CR data are available, CV ∼ CR + 0.3. The shape of the outburst is very peculiar; it shows a very sharp rise and decay, with a flat top, quite dissimilar to what was observed in 1984 and also dissimilar to the short outbursts observed in other IPs.
 |
Fig. 1. Time profile of the V1223 Sgr 2014 outburst (data from AAVSO). The visual CV and red CR + 0.3 data are shown by blue dots and red stars, respectively. |
V1223 Sgr went into a low state in 2018–2019, as shown by Covington et al. (2022). At the end of the normal-state recovery phase, the system underwent a series of outbursts that are shown in Fig. 2. The profiles of the 12 brightest outbursts are shown in Fig. 3, with the exception of the first outburst, for which the data – obtained by two different observers at the same time and in the same band – differ by as much as 1.3 mag. If the series of data points at V ∼ 13 during the first outburst and the peak of the outburst were overestimated by 1.3 mag, this would make the first outburst very similar to the other outbursts, both in duration and in peak luminosity; but this cannot be ascertained. One can note that the colour CV–CR remains approximately equal to 0.3 both in quiescence and at the outburst peak. We include data in Fig. 3 from the All-Sky Automated Survey for Supernovae (ASAS-SN, Shappee et al. 2014; Kochanek et al. 2017), which has poorer sampling than the AAVSO data. Two outbursts were detected by both the AAVSO and the ASAS-SN at JD 2458985 and 2459080, with possibly a third one at JD 2459053.
 |
Fig. 2. Light curve of V1223 Sgr (data from AAVSO). The unfiltered visual magnitude with the Bessel V zeropoint, CV, is shown in blue; the red points show the red magnitude CR plus 0.3. |
Between JD 2458970 and JD 2459200, observational gaps longer than 1, 5, and 15 h represent 67%, 64%, and 40% of this period, respectively, meaning almost as many bursts were missed as those observed. Given that 12 bursts reaching V = 12.5 were detected over an interval of 150 days, this would lead to an effective recurrence time of the order of 6 days. The ASAS-SN observation windows of V1223 Sgr during the outbursting period do not differ much from those of the AAVSO, and do not bring additional constraints on missed outbursts.
The outbursts profiles, as shown in Fig. 3, appear quite similar. Figure 4 shows further details of the outburst profiles of the eight outbursts that have the best time coverage. As in Fig. 3, time t = 0 is set at the peak of the observed flux, which may not be the true maximum of the outburst if the peak of the outburst has not been observed; this is the case in half of the cases presented here.
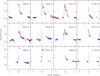 |
Fig. 3. Details of the V1223 Sgr outbursts (data from AAVSO). The stars represent data from the ASAS-SN. Here, CV data are shown in blue; the red points show the red magnitude plus 0.3. Time t = 0 is ascribed to the peak of the observed flux; the label in the upper right corner of each frame is the Julian date of the outburst peak minus 2458000. |
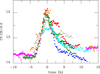 |
Fig. 4. Light curve of V1223 Sgr (data from AAVSO). Each colour corresponds to a different outburst. |
The short rise and less than 5 h interval between quiescence and maximum are features that are common to the observed profiles, while more variability is visible during the decay; the initial decline appears to be rather steep with typically a drop by one magnitude in less than two hours, and no significant variability appears from one outburst to another; the subsequent evolution shows more diversity, with, in some cases, tails lasting from five to ten hours and possibly secondary maxima.
These repetitive outbursts appear to be rare. AAVSO observations of V1223 Sgr are available from 1992 onwards, and no outburst brighter than V = 12 is present in the database with the exceptions of the 2014 outburst and of the 2020 series. However, observations were sparse until the 2014 outburst and the 2018 low state. One should also note that V1223 Sgr has mostly remained at V ≃ 13, and that the series of outbursts occurred at the end of the recovery from a low state, when the source was still fainter than usual by about 0.5–1 mag; no outburst was recorded after JD 2459120 when V was brighter than 13.5.
3. Short outbursts in other IPs
We explored the database of the AAVSO to search for short outbursts in known IPs. In the online version of the Ritter & Kolb (2003) catalogue, we selected the confirmed IPs that are brighter than V = 16 and searched for short (duration of less than a day) outbursts with a magnitude decrease of at least ΔV = 1.5 and for which a reasonable time profile was available. Apart from V1025 Cen, we did not find any other case of clusters of short outbursts, with the possible exception of TV Col, which we discuss below.
However, we did find isolated short outbursts in a few systems. Their characteristics are given in Table 1 and the outburst time profiles are given in Fig. 5. In four cases, the outburst peak was observed, meaning that the outburst amplitude is well determined, as is the duration, albeit to a lesser extent. In the case of the first outburst of NY Lup, the maximum is set by a single observational point that is much brighter than the neighbouring data points, which casts some doubt on the outburst amplitude. FO Aqr observations were performed using a CCD, but the band is not available.
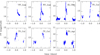 |
Fig. 5. Short IP outbursts present in the AAVSO database. |
Observed properties of short outbursts of IPs detected in the AAVSO database.
TV Col was previously known as an IP that experienced several short outbursts; the other two sources for which short outbursts have been reported, CXOGBS J174954.5−294335 and XY Ari, are too faint to be routinely observed by amateur astronomers. To our knowledge, outbursts have not been reported in FO Aqr, NY Lup, or EI UMa; a possible outburst from NY Lup has been reported (vsnet-alert 240691), but was not confirmed. The AAVSO database contains a significant number of observation sequences during which TV Col reached a magnitude of brighter than 12.5; these probably correspond to outbursts, but are usually visual observations, with large error bars, and the time coverage is sparse. Interestingly, TV Col had two outbursts that are separated by 3 days, occurring 33 days after the first outburst listed in Table 1. TV Col was observed for 5–7 h every night between the first two outbursts; it was also monitored after the third outburst, but there are a few gaps (up to five days), in the data; two upper limits (visual magnitude fainter than 12.8) exist in these gaps. Outbursts might therefore have been missed, but it appears unlikely that a series of ten or more outbursts, as in the case of V1223 Sgr or V1025 Cen, could have been missed. Nevertheless, a small series of outbursts might have been present.
As in V1223 Sgr, the rises to outburst appear to be shorter than the decays, and the outburst durations, when well constrained, are significantly shorter than one day. However, some outbursts appear to have a very sharp rise, as in the second outburst of NY Lup or that of EI UMa in Fig. 5.
Finally, in the AAVSO data, we also found what appears to be a normal dwarf nova outburst that occurred in V1062 Tau; it lasted for about 4 days and the peak magnitude was recorded at JD 2459277; the increase in V was 1.2. This source was previously not classified as a DN even though short and faint outbursts were reported (Lipkin et al. 2004). We also found the end of a superoutburst that occurred in CTCV J2056−3014 at JD 2459100, which was followed by a reflare. The total duration of the outburst was at least 20 days. This source was already known as a DN, but this is the first detection of a superoutburst, which classifies this source as a SU UMa; this classification is confirmed by the identification of superhumps (vsnet-alert 246652). A normal outburst was also found at JD 245983 which lasted for about 5 days. The outburst of V1026 Tau and the superoutburst of CTCV J2056−3014 are shown in the appendix.
4. Model
In order to interpret the short IP outbursts as magnetic–gating events, we first have to adapt the D’Angelo & Spruit (2010) model to the case of magnetised white dwarfs. In this model, the instability arises when the inner disc radius is close to the corotation radius rc, defined as the radius at which the centrifugal forces on matter corotating with the white dwarf balance gravity forces:
 (1)
(1)
where Ω is the rotation frequency of the white dwarf.
DS10 argue that the accretion disc interacts with the white dwarf magnetic field over a distance Δr which is small (contrary to the early assumptions of Ghosh et al. (1977), Ghosh & Lamb (1979a,b), which Wang (1987) later showed to be inconsistent).
DS10 define a characteristic accretion rate:
 (2)
(2)
where η is a numerical factor describing the distortion of the magnetic field by the disc, which they take as equal to 0.1, and μ is the magnetic moment of the white dwarf. Ṁc corresponds to the rate at which the inner disc radius, defined at the magnetospheric radius, is equal to the corotation radius. If the inner disc radius is less than rc, accretion can proceed, and the standard disc equations should apply. In the opposite case, the accretion rate is vanishingly small. When centrifugal forces prevent accretion, DS10 assume that the surface density is such that the viscous angular momentum transport outside the interaction region is balanced by the angular momentum flux added by the magnetic field across the interaction region. These authors find
 (3)
(3)
where Δr is the width of the interaction region. Because the interaction region between the disc and the magnetosphere is small but finite, the transition between the two situations is smooth; DS10 use an interpolation function of the form (1 + tanhx). The inner boundary condition νΣ = 0 at r = rin where ν is the kinematic viscosity coefficient, Σ the surface density, and rin the inner disc radius, then becomes
![Mathematical equation: $$ \begin{aligned} \nu \Sigma = \frac{2}{3 \pi } \frac{\Delta r}{r_{\rm c}} \left( \frac{r_{\rm c}}{r_{\rm in}} \right)^{9/2} \dot{M}_{\rm c} \left[ 1+\tanh \left( \frac{r_{\rm in}-r_{\rm c}}{\Delta r} \right) \right], \end{aligned} $$](/articles/aa/full_html/2022/08/aa43727-22/aa43727-22-eq4.gif) (4)
(4)
which reduces to Eq. (3) if the corotation radius is small and to νΣ = 0 when it is large. A similar approach to finding the position of the inner radius leads to
![Mathematical equation: $$ \begin{aligned} \dot{M} = -2 \pi r_{\rm in} \dot{r}_{\rm in} \Sigma + \frac{1}{2} \dot{M}_{\rm c} \left( \frac{r_{\rm c}}{r_{\rm in}} \right)^5 \left[ 1 - \tanh \left( \frac{r_{\rm in}-r_{\rm c}}{\Delta r_2} \right) \right], \end{aligned} $$](/articles/aa/full_html/2022/08/aa43727-22/aa43727-22-eq5.gif) (5)
(5)
where Ṁ is the local mass transfer rate at the inner edge – calculated using Eulerian derivatives – which differs from the actual accretion onto the white dwarf by the term containing the time derivative of the inner radius ṙin. Here, Δr2 is another characteristic length, which need not be equal to Δr, but is also assumed to be small as compared to rin. Equation (5) reduces to Ṁ = −2πrinṙinΣ if rin ≫ rc, that is, accretion is impossible, and to Ṁ = Ṁc(rc/rin)5 if rin ≪ rc. In the latter case, DS10 note that this sets the inner disc radius at a distance that differs from the standard magnetospheric radius obtained by equating the magnetic pressure to the ram pressure of spherically symmetric infalling matter, but not by a large amount.
Δr and Δr2 are therefore the two parameters that describe the interaction of the magnetic field with the accretion disc; they are assumed to be small, but DS10 find that, in order to be stable with respect to the interchange stability, the interaction region cannot be too small; in the following, unless otherwise noted, we adopt the values preferred by these latter authors, namely Δr/rin = 0.05 and Δr2/rin = 0.014.
The set of partial differential equations describing the time evolution of the accretion disc remains unaffected. DS10 furthermore assume that the viscosity in the accretion disc varies as ν = α(GM)1/2(H/r)2r1/2, where α is the Shakura–Sunyaev parameter and H is the disc scale height. These authors take α = 0.1 and a constant H/r = 0.1. They also assume that Δr/rin and Δr2/rin take constant values. With these hypotheses, only three parameters determine the time evolution of the disc: the ratio Ṁtr/Ṁc – where Ṁtr is the mass transfer rate from the secondary –, Δr/rin, and Δr2/rin. One should, in principle, add the outer disc radius rout, but, as we shall see later, the solution is almost independent of rout provided that rout is not too close to rin. The results from DS10, DS11, and DS12, although obtained in the context of low-mass X-ray binaries and young stars, should therefore be applicable to IPs.
Some of the above mentioned assumptions are unnecessary, and questionable in the case of IPs. In particular, the power-law dependence of the viscosity and the assumption H/r = 0.1 are not well justified in CVs3. We therefore used our code to solve the time-evolution equations of accretion discs (Hameury et al. 1998), with modified boundary conditions.
We first verified that we obtain the same results as DS10 when making the same assumptions, with the notable difference that the inner radius and mass accretion rate vary five times more rapidly than in DS10, although the shape and amplitude of these variations are identical. We also find the same instability zones, and in particular the two instability regions labelled RI and RII by DS12, where RI is located at low mass transfer rates for a relatively narrow range of Δr2/rin and RII is located at mass transfer rates close to Ṁc for a broad range of Δr2/rin. We checked that the disc stability and the outcome of the instability do not depend on the outer disc radius when it is large; there was no difference between rout = 400rin and rout = 40rin. These large rout/rin are appropriate for young stars and low-mass X-ray binaries; this is not the case for IPs in which this ratio is a few, and when we considered rout = 3rin, significant deviations from the large rout/rin case were found, such as for example a shortening of the instability period by a factor of 1.5.
We also noted that the outcome of the instability depends to a certain extent on the details of the assumed interaction between the magnetosphere and the accretion flow, which enter in the boundary condition. For example, replacing Δr/rin by Δr/rc in Eq. (4) results in stability zones that are significantly different, even though rc and rin do not differ by more than a few percent.
We then solved the full disc equations for a system with parameters appropriate for V1223 Sgr: orbital period Porb = 3.36 h, spin period Pspin = 0.207 h, primary mass M1 = 0.9 M⊙, and secondary mass M2 = 0.33 M⊙.
As systems exhibiting short outbursts do not show normal dwarf nova outbursts, they must be stable with respect to the thermal–viscous instability. This implies that either the mass transfer is low, with Ṁtr less than the maximum rate for being on the cold, stable branch at the inner edge of the disc,  , or that it is larger than the minimum rate for being on the hot branch estimated at the outer radius,
  . This requirement does not mean that individual systems cannot oscillate between high and low states without experiencing normal dwarf nova outbursts. This is possible if, for a disc initially sitting on the hot branch, the disc disappears before the mass transfer rate falls below
  as mentioned in Hameury & Lasota (2017b) and as was apparently observed in the case of FO Aqr (Littlefield et al. 2020).
The magnetic gating instability can exist in principle for very low mass-accretion rates, with Ṁtr/Ṁc as low as 10−5; the requirement that the disc is cold everywhere is therefore not incompatible with the criterion for the magnetic gating to be effective; howerer, this is not true for hot discs, because the magnetic gating instability does not exist for Ṁtr/Ṁc larger than about unity. We examine these two cases in turn, after discussing the conditions under which a disc forms.
4.1. Existence of a disc
The condition for the formation of a disc is, in the general case, rcirc > max(r*, rmag) (Frank et al. 2002), where rcirc is the circularisation radius, that is, the radius at which matter leaving the secondary star forms a circular orbit around the primary, r* is the radius of this latter, and rmag the magnetospheric radius. However, this condition does not apply when rcirc is of order of or slightly larger than rc. When this happens, matter cannot enter the magnetosphere because of centrifugal forces, and cannot be ejected from the system either because the velocity acquired by matter spun up at the magnetosphere is less that the escape velocity, unless rmag > 1.26rc (DS10). Therefore, if rc < rmag < 1.26rc, a disc forms that cannot initially accrete onto the white dwarf; matter piles up and the inner disc radius decreases until it becomes equal to rc (to within Δr), at which point accretion begins. A steady configuration is possible because there is a transfer of angular momentum from the primary to the accretion disc at its inner edge; this is not possible when the white dwarf rotates slowly and rc is large, in which case the condition rcirc > max(r*, rmag) still applies.
4.2. Cold discs
We assume here a magnetic moment μ = 1.5 × 1033 G cm3, hence rc = 1.2 × 1010 cm and Ṁc = 2.1 × 10¹⁶ g s−1. Our magnetic moment differs from the estimate by Norton et al. (2004) which does not apply because the white dwarf spin is not in equilibrium. When taking Δr/rin = 0.05 and Δr2/rin = 0.014 as in DS10, we find that the disc is unstable if the mass-transfer rate Ṁtr is less than 0.015 Ṁc = 4.1 × 10¹⁴ g s−1, which corresponds to instability zone RI, and for the range 6 × 10¹⁵ < Ṁtr < 1.0 × 10¹⁶ g s−1, or 0.2 < Ṁtr/Ṁc < 0.36. These values differ somewhat from the values that we obtain when using the simplified disc model used by DS10, which are Ṁtr/Ṁc < 0.124 and 0.97 < Ṁtr/Ṁc < 1.20. There are two main reasons for this difference. First, the viscosity does not scale as r1/2, but rather slightly decreases with radius; second, the outer disc radius rout is not large as compared to the inner radius: rout/rin is only 2.35. For these reasons, the periodicity of the instability is also shortened as compared to the simplified case; for Ṁtr/Ṁc = 0.072, the time interval between outbursts is reduced by a factor 2.5.
Figure 6 shows the outburst amplitude in a (Δr/rin,Ṁtr/Ṁc) plane. Four instability regions appear. The strong instabilities that appear at large Ṁtr/Ṁc, of order unity or larger, correspond to the normal dwarf nova instability. The instability threshold is larger than  , because of the stabilising effect of the boundary condition. The boundary condition expressed by Eq. (5) damps rapid variations in the mass-accretion rate because of its strong coupling with rin, which more than compensates the increase in Σ with respect to the standard νΣ = 0 condition. It is also worth noting that the unstable domain depends on Δr for the same reason: the smaller Δr, the stronger the coupling between inner-edge Ṁ and rin. A second, much weaker unstable region is found at lower mass-transfer rates and covers almost the full range of Δr. This region corresponds to a thermal instability that develops when the S-curves describing the thermal structure of the accretion disc show little wiggles, which are due, in general, to the dissociation of hydrogen molecules. Heating and cooling fronts propagate back and forth but do not cause strong instabilities because the viscosity parameter remains constant. These two zones are approximately parallel; the dependence on Δr should not come as a surprise because the inner boundary condition affects the whole disc as rout/rin is only a few. The other two regions correspond to the magnetic gating instability. The region centred on Δr/rin = 0.03 and Ṁtr/Ṁc = 0.2 is the second instability region (RII) in DS12; the region at Ṁtr/Ṁc < 0.02 and Δr/rin ∼ 0.07 is labelled RI in DS12.
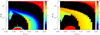 |
Fig. 6. Instability map in the cold disc case for μ33 = 1.5. Left: outburst amplitude defined as A = Ṁmax/Ṁtr. Here, Ṁc = 2.8 × 10¹⁶ g s−1. Right: logarithm of the recurrence time measured in days. Black areas correspond to stability. Regions labelled ‘RI’ and ‘RII’ correspond to the magnetic gating instability; the dwarf nova instability occurs in the region labelled ‘DN’, and a thermal instability due to the dissociation of the hydrogen molecule occurs in the region labelled ‘TI’. |
The time-variations of the accretion rate can be complex. Whereas low-amplitude variations (typically by a factor two or less) are almost sinusoidal, complex shapes consisting of multiply peaked periodic profiles are found when the instability is strong, and in particular when the magnetic gating instability couples with the thermal instability. Here, we define the recurrence time as the periodicity of the Ṁ variations, implying that the time interval between two outbursts may be shorter than the recurrence time. Transitions between simple and multiply peaked light curves correspond to a discontinuity of the recurrence time in Fig. 6. One must also note that when the amplitude of the magnetic gating instability is strong, recurrence times are large.
We did not explore the effect of varying Δr2 on the instability outcome. Judging from the DS12 results, varying Δr2 does have an influence on the instability amplitude and period, but this influence is significantly weaker than that of Δr variations (see DS12, Figs. 6 and 7). These latter authors also find that changing Δr2 does not alter the conclusion that short periods are obtained only when the amplitudes are low.
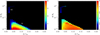 |
Fig. 7. Instability map in the hot disc case for μ33 = 15. Left: outburst amplitude defined as A = Ṁmax/Ṁtr; here, Ṁc = 2.8 × 10¹⁸ g s−1. Right: logarithm of the recurrence time measured in days. Regions labelled ‘RI’ and ‘RII’ correspond to the magnetic gating instability with the same label as in DS10. The white (left panel) and black (right panel) dots indicate the position of the light curve shown in Fig. 8 |
The magnetic gating can therefore develop in IPs with cold discs; however, this instability is not very strong, with amplitudes of less than typically a factor two except for very low mass-transfer rates of the order of a few times 1014 g s−1 or less (RI), but the recurrence time is then very long (a year or more). Shorter recurrence times of the order of days to weeks are found in the RII regime, but the amplitude is then low, implying that the fluctuations of the accretion rate are close to sinusoidal; the outburst duration is then longer than a few days. In summary, short outbursts cannot be produced by the magnetic gating instability in cold discs.
4.3. Hot discs
The disc is hot and stable with respect to the thermal-viscous instability if the mass transfer rate is larger than  . On the other hand, Ṁtr has to be less than about Ṁc for the magnetic gating instability to be effective, which leads to the following condition for the latter to operate:
 (6)
(6)
where we have used the analytic fits for  provided by Lasota et al. (2008), neglecting the very weak dependence on α. Here, Ṁtr is measured in g s−1, rout, 10 is the outer disc radius measured in 1010 cm, Psp, hr is the white dwarf spin period measured in hours, and μ33 is the magnetic moment in units of 1033 G. This condition is satisfied if the magnetic moment is larger than a critical value:
 (7)
(7)
For the parameters of V1223 Sgr, this requires μ33 > 3.6. In order to be able to explore a large domain in Ṁtr, we assume μ33 = 15 in the following. Such a large μ33 would be more appropriate for polars, but is required if one wishes to consider mass-transfer rates as low as 10−2 Ṁc.
Figure 7 shows the unstable domains for hot discs. As in the cold case, we find two well-separated instability regions for the magnetic gating instability, one at low mass-transfer rates, and one for high mass-transfer rates. The unstable region does not extend much below Ṁtr/Ṁc = 10−2 because the host disc then becomes subject to the thermal–viscous instability. Indeed, for Δr/rin = 0.1, the disc is unstable at Ṁtr/Ṁc = 10−2. The thermal–viscous instability is triggered at lower Ṁtr than in the non-magnetic case, because the boundary condition (4) results in a larger Σ throughout the disc; the non-magnetic and magnetic steady-state solutions deviate by a term of the order of 1 − (rin/r)1/2 which is significant everywhere because rout/rin is of the order of a few at most. In the case shown in Fig. 7,  is 0.05, meaning that the critical mass-transfer rate for the thermal–viscous instability is reduced by a factor of 5.
As in the cold disc case, the unstable domain with high mass-transfer rates has low amplitudes and short recurrence times; this corresponds to the region labelled RII in DS12. In this regime, the accretion rate varies smoothly by less than a factor of two with a period of a few hours; this requires Ṁtr larger than about 1018 g s−1 for μ33 = 15, and this limit scales as μ2.
On the other hand, the regime at low mass-transfer rates, with Ṁtr < 5 × 10¹⁶ g s−1 is unstable if Δr/rin is in the range 0.05–0.10, resulting in large amplitudes of the order of 10–20, and relatively short periodicities. These correspond well to the sequence of short outbursts observed in V1223 Sgr. As an illustration, Fig. 8 shows the variations of the mass-accretion rate when Ṁtr = 0.045 Ṁc = 1.24 × 10¹⁷ g s−1, Δr/rin = 0.04. These parameters correspond to a point in the instability map (Fig. 7) located at about half the maximum unstable mass-transfer rate in the RI region. The light curve shows outbursts with a FWHM of 5.1 h and a recurrence rate of 1.5 d. As our simulations show that the disc is still stable on the hot branch for mass transfer rates that are five times smaller than those considered here, one would obtain similar results with μ33 = 7, which is more appropriate for an IP. For reference, Fig. 9 shows a few additional examples of light curves that we obtained. In all cases, the outbursts FWHM is a few hours. As mentioned above, sinusoidal light curves are obtained only when the system is close to stability and only for a narrow range of parameters. Large amplitudes are obtained for low mass-transfer rates, which require large magnetic moments for the disc to be in the hot state, and are thus unlikely to occur in real systems.
 |
Fig. 8. Example of light curve obtained with μ33 = 15, Δr/rin = 0.04, Δr2/rin = 0.014 and Ṁtr = 1.24 × 10¹⁷ g s−1. |
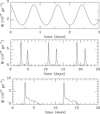 |
Fig. 9. Additional examples of light curves obtained with μ33 = 15 and Δr2/rin = 0.014: top: Δr/rin = 0.04 and Ṁtr/Ṁc = 0.080. Intermediate: Δr/rin = 0.04 and Ṁtr/Ṁc = 0.016. Bottom: Δr/rin = 0.05 and Ṁtr/Ṁc = 0.025. |
We can now revisit the minimum μ required for the magnetic gating instability to be effective in a hot disc. We assume that the limiting Ṁtr/Ṁc is unity, while our simulations show that it is of the order of 0.09; on the other hand, we overestimated the minimum mass transfer (by a factor of five) required for the disc to be hot and thermally stable. Correcting for these, we now obtain
 (8)
(8)
One should note that the outer disc radius can be smaller than the tidal truncation radius if the disc mass is not large and if the mass transfer rate is not constant but steadily increases. This occurs in particular when the system emerges from a low state, and might explain why sequences of short outbursts were observed in V1223 Sgr as well as in V1025 Cen precisely when the system was getting back to a normal state after a low state. This would allow lower magnetic moments and mass-transfer rates.
4.4. V1025 Cen
The recurrence and duration of V1025 Cen outbursts (Littlefield et al. 2022) are similar to those of V1223 Sgr. One therefore requires similar parameters as for V1223 Sgr to reproduce the observed lightcurve; in particular Ṁtr/Ṁc ≃ 0.05. V1025 Cen has an orbital period of 85 min, and a spin period of 36 min (Buckley et al. 1998; Hellier et al. 1998). The corotation radius is therefore  cm. The primary mass is very uncertain; Suleimanov et al. (2019) find M1 = 0.61 ± 0.14 M⊙ from X-ray observations; here, we take M1 = 0.8 M⊙, corresponding to the average primary mass in IPs. The outer disc radius can reach the spherical Roche radius of the primary which, for a mass ratio of 0.05, is 2.68 × 1010 cm, only slightly larger than rc = 2.32 × 1010 cm. This means that the direct applicability of the model questionable, because rin ≈ rc is so close to rout that the accretion flow forms a ring (torus) rather than a proper disc. Hellier et al. (2002b) find that phase-resolved spectroscopy observations of V1025 Cen cannot be readily explained in either the classical disc-fed, the stream-fed, or even the disc-overflow scenarios, making the nature of the accretion flow quite uncertain. The magnetic gating may still operate, but the predictions of the model in its present form cannot be taken at face value. Similarly, the stability of the disc with respect to the thermal–viscous instability – which sets the minimum Ṁtr – is also questionable. That said, the light curve in Fig. 8 is very similar in appearance to the one observed in V1025 Cen (see Fig. 3 in Littlefield et al. 2022).
5. Conclusions
We show that the sequence of short outbursts discovered by Covington et al. (2022) in V1223 Sgr, lasting for a few hours and recurring every few days, is very similar to that observed in V1025 Cen by Littlefield et al. (2022). Exploring the AAVSO database, we find that TV Col might have had several closely spaced short outbursts, but the data coverage is insufficient to confirm this.
These outbursts are similar in duration and amplitude to the isolated outbursts found in a few IPs, and in particular TV Col. Examination of the AAVSO data base led us to the identification of three new IPs that showed short isolated outbursts: FO Aqr, NY Lup, and RI UMa. As a byproduct of this analysis, we found a normal DN outburst in V1062 Tau, which was not previously known as a DN, and a superoutburst in CTCV J2056-3014, making it the third IP member of the SU UMa class.
These outbursts cannot be due to the thermal–viscous instability of accretion discs that accounts for the dwarf nova phenomenon, because both the recurrence time and the outburst duration are too short. Instead, we show that the series of short bursts observed in V1223 Sgr can be explained by the magnetic–gating instability model proposed by Spruit & Taam (1993) and further developed by DS10 and DS12 in the context of LMXBs and young stars. We adapted their model to the context of IPs. We find that the properties of the magnetic instability are qualitatively similar when using realistic models of accretion discs and when using simplified models with power-law variations, but both the unstable regions, the recurrence time, and the amplitude of fluctuations may differ significantly. We argue that, judging from the light curve, the magnetic–gating instability should also be the cause of the V1025 Cen series of outbursts, but in this case the model should be adapted to an accretion torus as the presence of an accretion disc in this system is unlikely.
We find that the magnetic gating instability may exist in cold discs, but the quiescence intervals and the outburst duration are far too long to account for the observations. When the entire disc is hot and stable with respect to the thermal–viscous instability, it can be subject to the magnetic–gating instability if the magnetic field of the white dwarf is strong enough.
Whether or not isolated outbursts can be due to the magnetic–gating instability remains an open question. The magnetic gating instability can produce long recurrence times, of the order of a month or possibly more; however, the outburst duration would then also be long, because the ratio between the outburst recurrence time and duration is typically the ratio between the mean mass-transfer rate and peak accretion rate, which does not exceed 30 for the cases considered here. It is also interesting to note that the time profiles of isolated outbursts sometimes have a sharp rise and a slower decay, in contrast with the almost symmetric profiles observed in V1223 Sgr and V1025 Cen.
We finally note that our models rely on a stability analysis of the steady state. However, this is not well justified, because the relaxation time needed to reach this steady state – which is defined by the ratio of the disc mass to the mass transfer rate – can be long; for example, in the case shown in Fig. 8, it is 50 days. This implies that, if the mass-transfer rate Ṁtr varies on timescales of the order of 50 days or shorter, the outcome of the magnetic–gating instability will depend on the history of Ṁtr and might explain why the existence of outbursts does not depend only on Ṁtr.
Not that they are more justified in accretion discs in other systems.
Acknowledgments
We acknowledge with thanks the variable star observations from the AAVSO International Database contributed by observers worldwide and used in this research. JPL was supported in part by a grant form the French Space Agency CNES.
References
- Angelini, L., & Verbunt, F. 1989, MNRAS, 238, 697 [NASA ADS] [Google Scholar]
- Augusteijn, T., Tappert, C., Dall, T., & Maza, J. 2010, MNRAS, 405, 621 [NASA ADS] [Google Scholar]
- Beuermann, K., Harrison, T. E., McArthur, B. E., Benedict, G. F., & Gänsicke, B. T. 2004, A&A, 419, 291 [NASA ADS] [CrossRef] [EDP Sciences] [Google Scholar]
- Bruch, A. 2018, New Astron., 58, 53 [NASA ADS] [CrossRef] [Google Scholar]
- Buckley, D. A. H., Cropper, M., Ramsay, G., & Wickramasinghe, D. T. 1998, MNRAS, 299, 83 [NASA ADS] [CrossRef] [Google Scholar]
- Covington, A. E., Shaw, A. W., Mukai, K., et al. 2022, ApJ, 928, 164 [NASA ADS] [CrossRef] [Google Scholar]
- D’Angelo, C. R., & Spruit, H. C. 2010, MNRAS, 406, 1208 [NASA ADS] [Google Scholar]
- D’Angelo, C. R., & Spruit, H. C. 2011, MNRAS, 416, 893 [CrossRef] [Google Scholar]
- D’Angelo, C. R., & Spruit, H. C. 2012, MNRAS, 420, 416 [Google Scholar]
- Dubus, G., Otulakowska-Hypka, M., & Lasota, J.-P. 2018, A&A, 617, A26 [NASA ADS] [CrossRef] [EDP Sciences] [Google Scholar]
- Frank, J., King, A., & Raine, D. J. 2002, Accretion Power in Astrophysics, 3rd edn. (Cambridge: Cambridge University Press) [Google Scholar]
- Gaia Collaboration (Brown, A. G. A., et al.) 2018, A&A, 616, A1 [NASA ADS] [CrossRef] [EDP Sciences] [Google Scholar]
- Ghosh, P., & Lamb, F. K. 1979a, ApJ, 232, 259 [Google Scholar]
- Ghosh, P., & Lamb, F. K. 1979b, ApJ, 234, 296 [Google Scholar]
- Ghosh, P., Lamb, F. K., & Pethick, C. J. 1977, ApJ, 217, 578 [Google Scholar]
- Hameury, J. M. 2020, AdSpR, 66, 1004 [NASA ADS] [Google Scholar]
- Hameury, J. M., & Lasota, J. P. 1985, A&A, 145, L10 [NASA ADS] [Google Scholar]
- Hameury, J. M., & Lasota, J. P. 2017a, A&A, 602, A102 [Google Scholar]
- Hameury, J. M., & Lasota, J. P. 2017b, A&A, 606, A7 [Google Scholar]
- Hameury, J.-M., Menou, K., Dubus, G., Lasota, J.-P., & Hure, J.-M. 1998, MNRAS, 298, 1048 [Google Scholar]
- Hayashi, T., & Ishida, M. 2014, MNRAS, 441, 3718 [NASA ADS] [CrossRef] [Google Scholar]
- Hayashi, T., Kitaguchi, T., & Ishida, M. 2021, MNRAS, 504, 3651 [NASA ADS] [CrossRef] [Google Scholar]
- Hellier, C., & Buckley, D. A. H. 1993, MNRAS, 265, 766 [NASA ADS] [CrossRef] [Google Scholar]
- Hellier, C., Beardmore, A. P., & Buckley, D. A. H. 1998, MNRAS, 299, 851 [NASA ADS] [CrossRef] [Google Scholar]
- Hellier, C., Beardmore, A. P., & Mukai, K. 2002a, A&A, 389, 904 [NASA ADS] [CrossRef] [EDP Sciences] [Google Scholar]
- Hellier, C., Wynn, G. A., & Buckley, D. A. H. 2002b, MNRAS, 333, 84 [NASA ADS] [CrossRef] [Google Scholar]
- Hudec, R., Šimon, V., & Skalický, J. 2005, in The Astrophysics of Cataclysmic Variables and Related Objects, eds. J. M. Hameury, & J. P. Lasota, ASP Conf. Ser., 330, 405 [NASA ADS] [Google Scholar]
- Johnson, C. B., Torres, M. A. P., Hynes, R. I., et al. 2017, MNRAS, 466, 129 [NASA ADS] [CrossRef] [Google Scholar]
- Kochanek, C. S., Shappee, B. J., Stanek, K. Z., et al. 2017, PASP, 129, 4502 [Google Scholar]
- Lasota, J.-P. 2001, New Astron. Rev., 45, 449 [Google Scholar]
- Lasota, J. P., Dubus, G., & Kruk, K. 2008, A&A, 486, 523 [NASA ADS] [CrossRef] [EDP Sciences] [Google Scholar]
- Lipkin, Y. M., Leibowitz, E. M., & Orio, M. 2004, MNRAS, 349, 1323 [NASA ADS] [CrossRef] [Google Scholar]
- Littlefield, C., Garnavich, P., Kennedy, M. R., et al. 2020, ApJ, 896, 116 [NASA ADS] [CrossRef] [Google Scholar]
- Littlefield, C., Lasota, J.-P., Hameury, J.-M., et al. 2022, ApJ, 924, L8 [NASA ADS] [CrossRef] [Google Scholar]
- Lopes Oliveira, R., Bruch, A., Rodrigues, C. V., Oliveira, A. S., & Mukai, K. 2020, ApJ, 898, L40 [NASA ADS] [CrossRef] [Google Scholar]
- Mhlahlo, N., Buckley, D. A. H., Dhillon, V. S., et al. 2007, MNRAS, 380, 353 [NASA ADS] [CrossRef] [Google Scholar]
- Norton, A. J., Wynn, G. A., & Somerscales, R. V. 2004, ApJ, 614, 349 [NASA ADS] [CrossRef] [Google Scholar]
- Patterson, J., de Miguel, E., Kemp, J., et al. 2020, ApJ, 897, 70 [NASA ADS] [CrossRef] [Google Scholar]
- Penning, W. R. 1985, ApJ, 289, 300 [NASA ADS] [CrossRef] [Google Scholar]
- Ritter, H., & Kolb, U. 2003, A&A, 404, 301 [NASA ADS] [CrossRef] [EDP Sciences] [Google Scholar]
- Scaringi, S., Maccarone, T. J., D’Angelo, C., Knigge, C., & Groot, P. J. 2017, Nature, 552, 210 [NASA ADS] [CrossRef] [Google Scholar]
- Scaringi, S., de Martino, D., Buckley, D. A. H., et al. 2022a, Nat. Astron., 6, 98 [NASA ADS] [CrossRef] [Google Scholar]
- Scaringi, S., Groot, P. J., Knigge, C., et al. 2022b, Nature, 604, 447 [NASA ADS] [CrossRef] [Google Scholar]
- Scaringi, S., Groot, P. J., Knigge, C., et al. 2022c, MNRAS, 514, L11 [NASA ADS] [CrossRef] [Google Scholar]
- Schwarz, H. E., van Amerongen, S., Heemskerk, M. H. M., & van Paradijs, J. 1988, A&A, 202, L16 [NASA ADS] [Google Scholar]
- Shappee, B. J., Prieto, J. L., Grupe, D., et al. 2014, ApJ, 788, 48 [Google Scholar]
- Shaw, A. W., Heinke, C. O., Mukai, K., et al. 2018, MNRAS, 476, 554 [NASA ADS] [CrossRef] [Google Scholar]
- Spruit, H. C., & Taam, R. E. 1993, ApJ, 402, 593 [CrossRef] [Google Scholar]
- Suleimanov, V. F., Doroshenko, V., & Werner, K. 2019, MNRAS, 482, 3622 [NASA ADS] [CrossRef] [Google Scholar]
- Szkody, P., & Mateo, M. 1984, ApJ, 280, 729 [NASA ADS] [CrossRef] [Google Scholar]
- van Amerongen, S., & van Paradijs, J. 1989, A&A, 219, 195 [NASA ADS] [Google Scholar]
- Wang, Y. M. 1987, A&A, 183, 257 [Google Scholar]
- Warner, B. 2003, Cataclysmic Variable Stars (Cambridge: Cambridge University Press) [Google Scholar]
Appendix A: Light curves of V1062 Tau and CTCV J2056-3014
We show here the light curves of V1062 Tau and CTCV J2056-3014 during outbursts.
V1062 Tau has an orbital period of 9.95 h and a spin period of 62 min (Hellier et al. 2002a), and was known for having short (1–2 days) and weak (less than 1 mag) outbursts (Lipkin et al. 2004); because of a limited sampling, the full outburst duration could not be covered, making it difficult to estimate its characteristics, or even to ascertain whether or not these were real bursts. Figure A.1 shows the time profile of what appears to be a standard but faint outburst. Its amplitude was 1.2 mag and it lasted for about a week. Data were obtained by 11 observers.
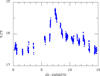 |
Fig. A.1. Time profile of the outburst of V1062 Tau (data from AAVSO). The visual V and CV data are shown by dots and stars respectively. |
CTCV J2056-3014 is an IP with an orbital period of 1.76 h (Augusteijn et al. 2010). Lopes Oliveira et al. (2020) found that the white dwarf is spinning very rapidly, with a spin period of 29.6 s, which means that the magnetic field is low, presumably of the order of 6 × 1030G cm3. This source was known to be variable, with strong flickering (Bruch 2018), and is classified as a dwarf nova in the Ritter & Kolb (2003) catalogue. The time profile is shown in Fig. A.2. A normal outburst lasting for about five days was also detected in 2017; its maximum was on August 8. Its time profile is shown in Fig. A.3. Data in the CV band were obtained by Franz-Josef Hambsch, and data in the CR band by Libert Monard.
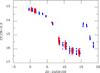 |
Fig. A.2. Time profile of the superoutburst of CTCV J2056-3014 (data from AAVSO). The visual CV and red CR + 0.3 data are shown by blue dots and red stars respectively. |
 |
Fig. A.3. Time profile of the 2017 normal outburst of CTCV J2056-3014 (data from AAVSO). |
All Tables
All Figures
|
Fig. 1. Time profile of the V1223 Sgr 2014 outburst (data from AAVSO). The visual CV and red CR + 0.3 data are shown by blue dots and red stars, respectively. |
| In the text | |
|
Fig. 2. Light curve of V1223 Sgr (data from AAVSO). The unfiltered visual magnitude with the Bessel V zeropoint, CV, is shown in blue; the red points show the red magnitude CR plus 0.3. |
| In the text | |
|
Fig. 3. Details of the V1223 Sgr outbursts (data from AAVSO). The stars represent data from the ASAS-SN. Here, CV data are shown in blue; the red points show the red magnitude plus 0.3. Time t = 0 is ascribed to the peak of the observed flux; the label in the upper right corner of each frame is the Julian date of the outburst peak minus 2458000. |
| In the text | |
|
Fig. 4. Light curve of V1223 Sgr (data from AAVSO). Each colour corresponds to a different outburst. |
| In the text | |
|
Fig. 5. Short IP outbursts present in the AAVSO database. |
| In the text | |
|
Fig. 6. Instability map in the cold disc case for μ33 = 1.5. Left: outburst amplitude defined as A = Ṁmax/Ṁtr. Here, Ṁc = 2.8 × 10¹⁶ g s−1. Right: logarithm of the recurrence time measured in days. Black areas correspond to stability. Regions labelled ‘RI’ and ‘RII’ correspond to the magnetic gating instability; the dwarf nova instability occurs in the region labelled ‘DN’, and a thermal instability due to the dissociation of the hydrogen molecule occurs in the region labelled ‘TI’. |
| In the text | |
|
Fig. 7. Instability map in the hot disc case for μ33 = 15. Left: outburst amplitude defined as A = Ṁmax/Ṁtr; here, Ṁc = 2.8 × 10¹⁸ g s−1. Right: logarithm of the recurrence time measured in days. Regions labelled ‘RI’ and ‘RII’ correspond to the magnetic gating instability with the same label as in DS10. The white (left panel) and black (right panel) dots indicate the position of the light curve shown in Fig. 8 |
| In the text | |
|
Fig. 8. Example of light curve obtained with μ33 = 15, Δr/rin = 0.04, Δr2/rin = 0.014 and Ṁtr = 1.24 × 10¹⁷ g s−1. |
| In the text | |
|
Fig. 9. Additional examples of light curves obtained with μ33 = 15 and Δr2/rin = 0.014: top: Δr/rin = 0.04 and Ṁtr/Ṁc = 0.080. Intermediate: Δr/rin = 0.04 and Ṁtr/Ṁc = 0.016. Bottom: Δr/rin = 0.05 and Ṁtr/Ṁc = 0.025. |
| In the text | |
|
Fig. A.1. Time profile of the outburst of V1062 Tau (data from AAVSO). The visual V and CV data are shown by dots and stars respectively. |
| In the text | |
|
Fig. A.2. Time profile of the superoutburst of CTCV J2056-3014 (data from AAVSO). The visual CV and red CR + 0.3 data are shown by blue dots and red stars respectively. |
| In the text | |
|
Fig. A.3. Time profile of the 2017 normal outburst of CTCV J2056-3014 (data from AAVSO). |
| In the text | |
Current usage metrics show cumulative count of Article Views (full-text article views including HTML views, PDF and ePub downloads, according to the available data) and Abstracts Views on Vision4Press platform.
Data correspond to usage on the plateform after 2015. The current usage metrics is available 48-96 hours after online publication and is updated daily on week days.
Initial download of the metrics may take a while.