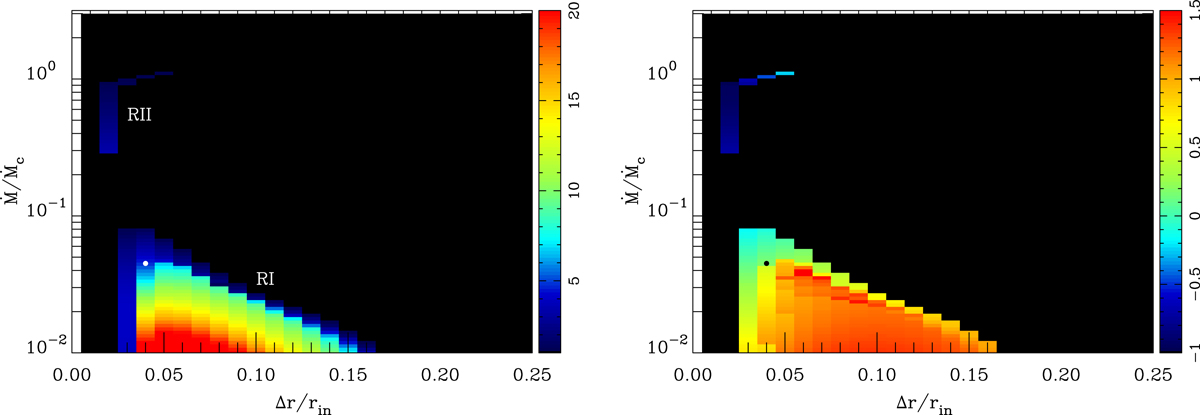
Fig. 7.
Download original image
Instability map in the hot disc case for μ33 = 15. Left: outburst amplitude defined as A = Ṁmax/Ṁtr; here, Ṁc = 2.8 × 10¹⁸ g s−1. Right: logarithm of the recurrence time measured in days. Regions labelled ‘RI’ and ‘RII’ correspond to the magnetic gating instability with the same label as in DS10. The white (left panel) and black (right panel) dots indicate the position of the light curve shown in Fig. 8
Current usage metrics show cumulative count of Article Views (full-text article views including HTML views, PDF and ePub downloads, according to the available data) and Abstracts Views on Vision4Press platform.
Data correspond to usage on the plateform after 2015. The current usage metrics is available 48-96 hours after online publication and is updated daily on week days.
Initial download of the metrics may take a while.