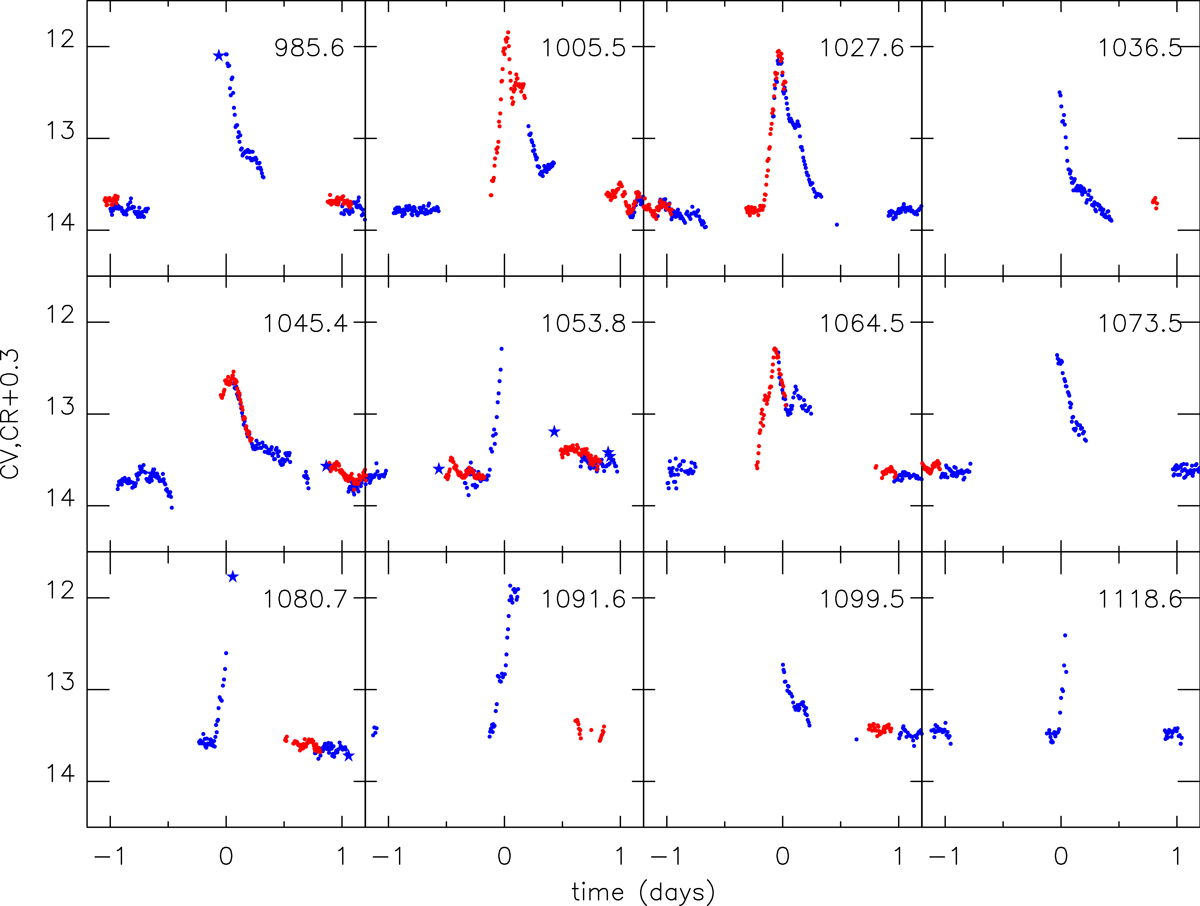
Fig. 3.
Download original image
Details of the V1223 Sgr outbursts (data from AAVSO). The stars represent data from the ASAS-SN. Here, CV data are shown in blue; the red points show the red magnitude plus 0.3. Time t = 0 is ascribed to the peak of the observed flux; the label in the upper right corner of each frame is the Julian date of the outburst peak minus 2458000.
Current usage metrics show cumulative count of Article Views (full-text article views including HTML views, PDF and ePub downloads, according to the available data) and Abstracts Views on Vision4Press platform.
Data correspond to usage on the plateform after 2015. The current usage metrics is available 48-96 hours after online publication and is updated daily on week days.
Initial download of the metrics may take a while.