Open Access
Fig. A.2.
Download original image
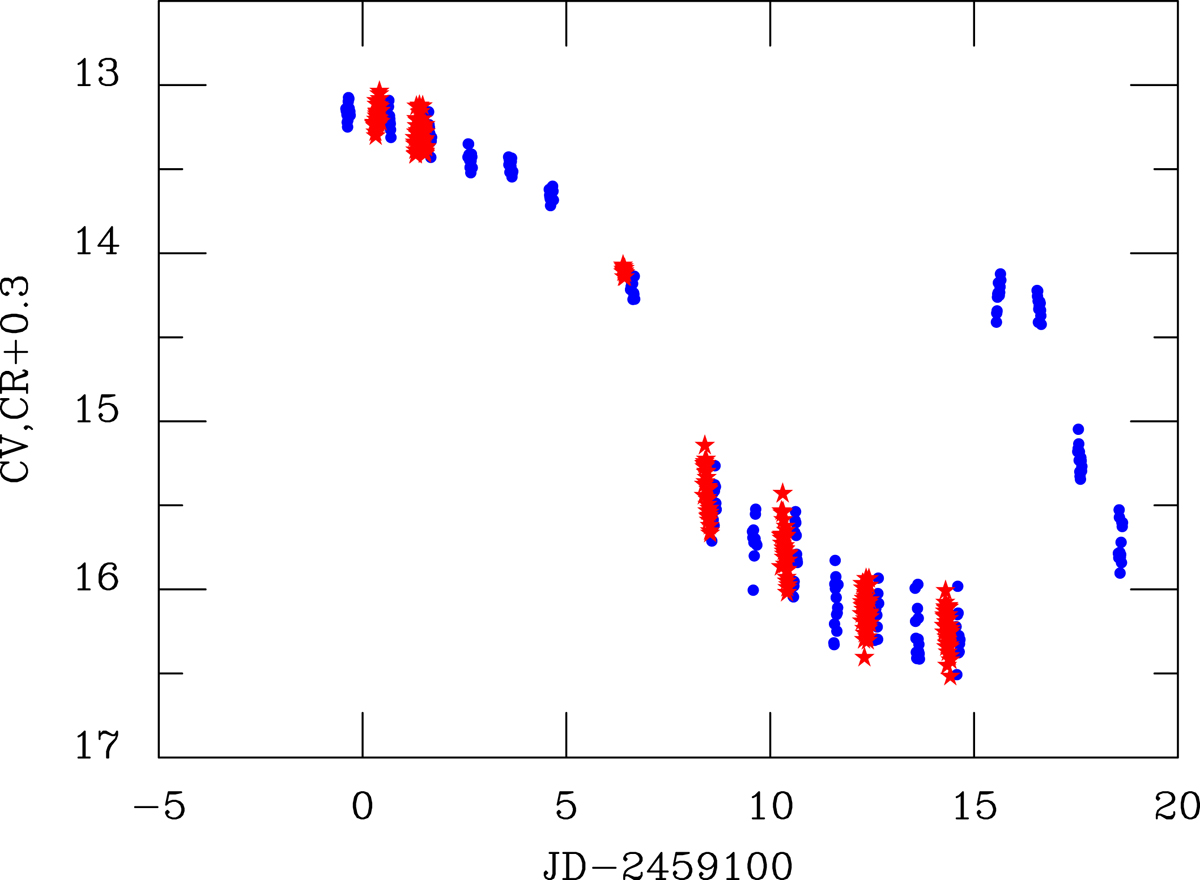
Time profile of the superoutburst of CTCV J2056-3014 (data from AAVSO). The visual CV and red CR + 0.3 data are shown by blue dots and red stars respectively.
Current usage metrics show cumulative count of Article Views (full-text article views including HTML views, PDF and ePub downloads, according to the available data) and Abstracts Views on Vision4Press platform.
Data correspond to usage on the plateform after 2015. The current usage metrics is available 48-96 hours after online publication and is updated daily on week days.
Initial download of the metrics may take a while.