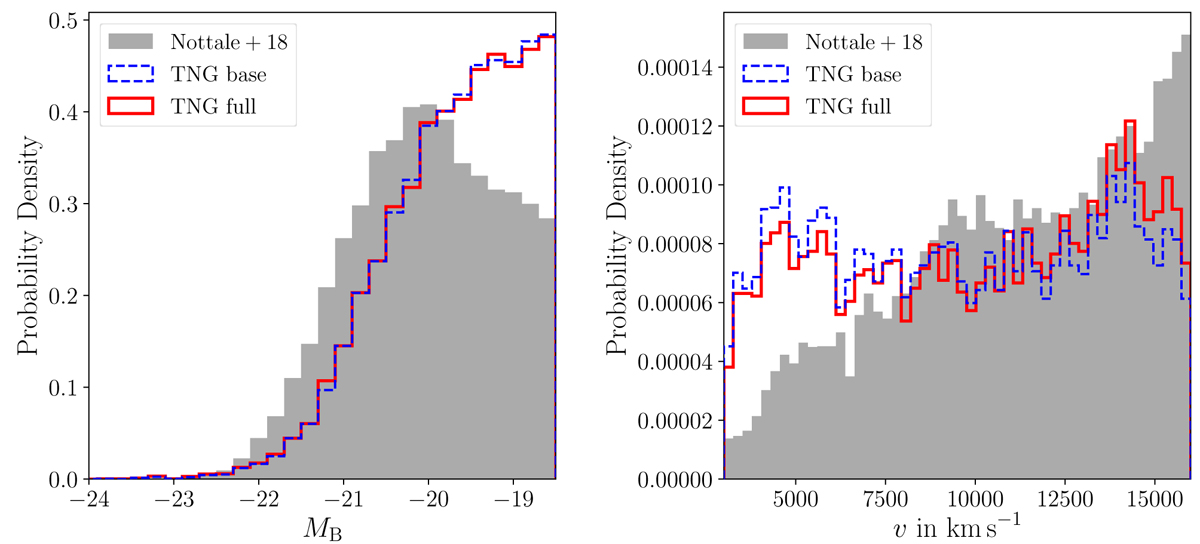
Fig. A.1.
Download original image
Properties of galaxy pairs for the observed galaxy pair catalog properties from Nottale & Chamaraux (2018a) (grey shaded histograms) and galaxy data from the IlustrisTNG-300 simulation. For the latter, the blue histogram corresponds to our base model without velocity errors, and the red histograms are from our full model mimicking apparent magnitude biases and errors on the observed line-of-sight velocity. Left panel: Distribution of galaxy pair members in B-band magnitude MB. Right panel: Distribution of galaxy pairs in velocity, v, consisting of redshift and peculiar velocity.
Current usage metrics show cumulative count of Article Views (full-text article views including HTML views, PDF and ePub downloads, according to the available data) and Abstracts Views on Vision4Press platform.
Data correspond to usage on the plateform after 2015. The current usage metrics is available 48-96 hours after online publication and is updated daily on week days.
Initial download of the metrics may take a while.