Fig. 7
Download original image
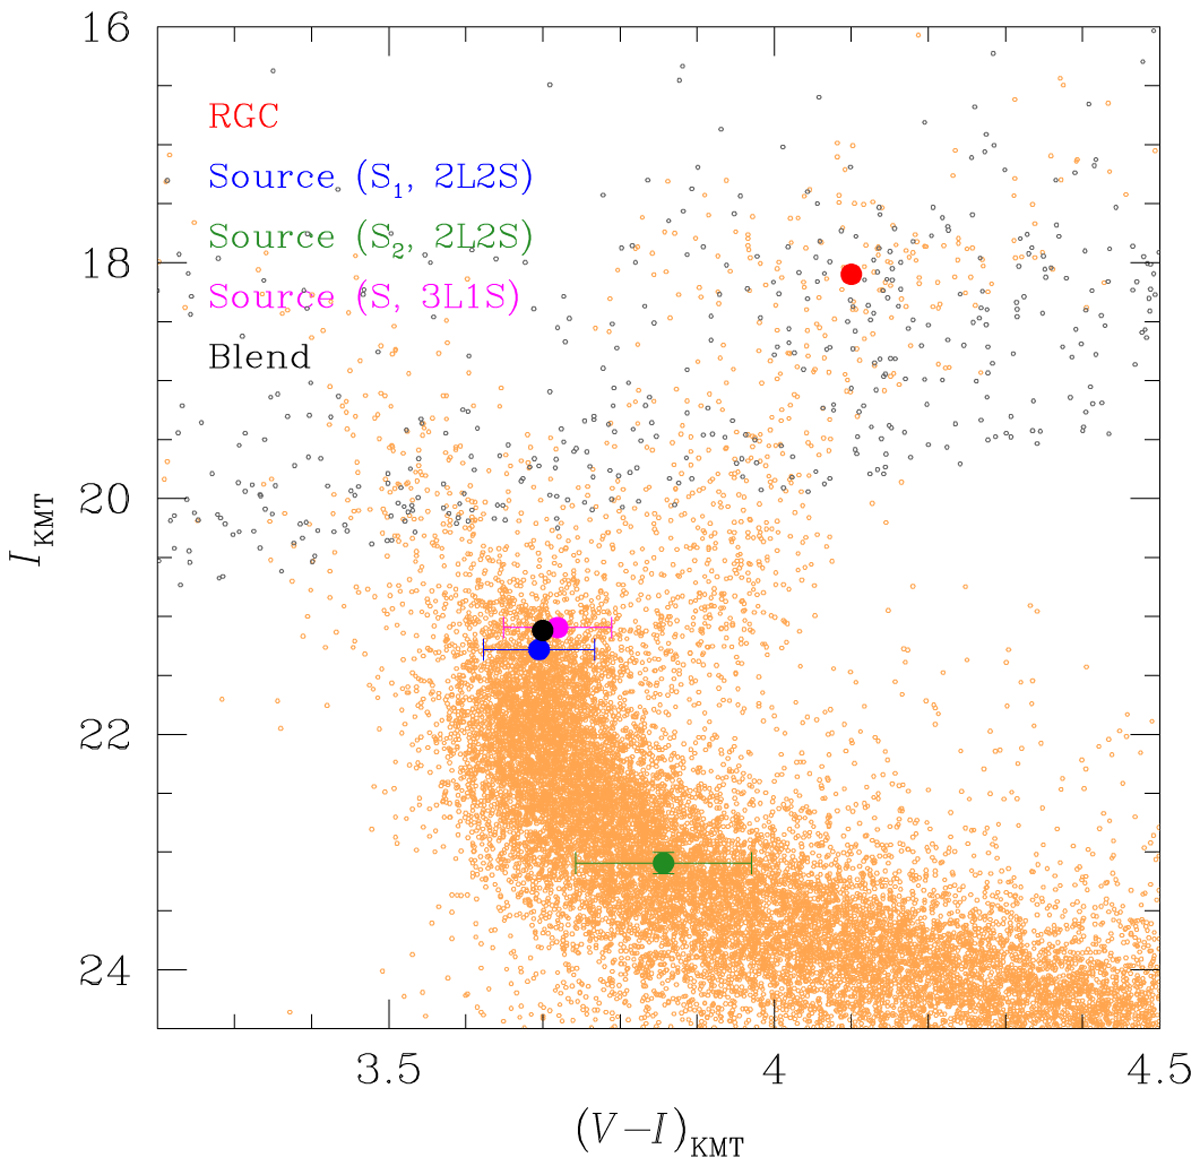
Color-magnitude diagram (CMD) constructed from the combination of the HST and ground-based (KMTNet) observations. The small filled dot marked in magenta indicates the source position according to the 3L1S solution, and the blue and green dots represent the positions of the primary and secondary source stars estimated from the 2L2S solution, respectively. The red dot denotes the centroid of red giant clump (RGC).
Current usage metrics show cumulative count of Article Views (full-text article views including HTML views, PDF and ePub downloads, according to the available data) and Abstracts Views on Vision4Press platform.
Data correspond to usage on the plateform after 2015. The current usage metrics is available 48-96 hours after online publication and is updated daily on week days.
Initial download of the metrics may take a while.