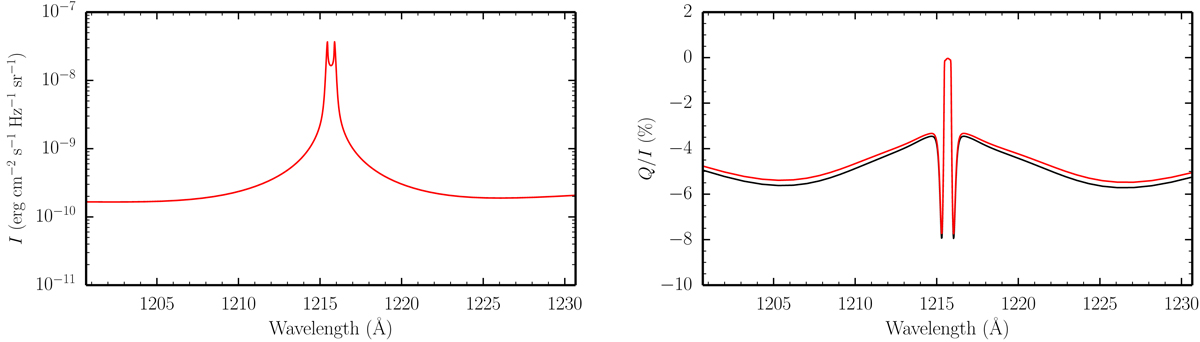
Fig. B.2.
Download original image
Stokes I (left panel) and Q/I (right panel) profiles as a function of wavelength obtained from PRD calculations in the absence of a magnetic field. The black and red curves represent the calculations obtained considering the redistribution matrices given in Eqs. (10) and (11) and those given in Eq. (C.23), respectively. The latter calculation was considered in order to reproduce the results of Belluzzi et al. (2012).
Current usage metrics show cumulative count of Article Views (full-text article views including HTML views, PDF and ePub downloads, according to the available data) and Abstracts Views on Vision4Press platform.
Data correspond to usage on the plateform after 2015. The current usage metrics is available 48-96 hours after online publication and is updated daily on week days.
Initial download of the metrics may take a while.