Fig. B.1.
Download original image
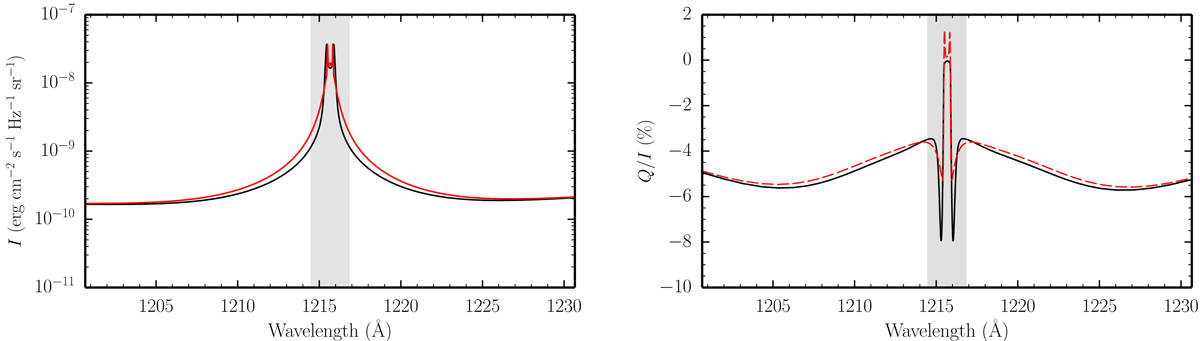
Stokes I (left panel) and Q/I (right panel) profiles as a function of vacuum wavelength for the H I Lyman-α line, obtained in the absence of a magnetic field. The solid black curves correspond to reference PRD calculations, whereas the red curves represent the results of calculations considering the approximate redistribution matrix ![]() (see main text). In the right panel, the latter curve is dashed to enhance visibility. The shaded areas have a width of 2.4 Å and indicate the spectral region where the latter approximation is not expected to be suitable. For all the calculations presented in this Appendix, the FAL-C atmospheric model is considered. For the figures in this Appendix we consider an LOS with μ = 0.1 and take the direction for positive Stokes Q parallel to the limb.
(see main text). In the right panel, the latter curve is dashed to enhance visibility. The shaded areas have a width of 2.4 Å and indicate the spectral region where the latter approximation is not expected to be suitable. For all the calculations presented in this Appendix, the FAL-C atmospheric model is considered. For the figures in this Appendix we consider an LOS with μ = 0.1 and take the direction for positive Stokes Q parallel to the limb.
Current usage metrics show cumulative count of Article Views (full-text article views including HTML views, PDF and ePub downloads, according to the available data) and Abstracts Views on Vision4Press platform.
Data correspond to usage on the plateform after 2015. The current usage metrics is available 48-96 hours after online publication and is updated daily on week days.
Initial download of the metrics may take a while.