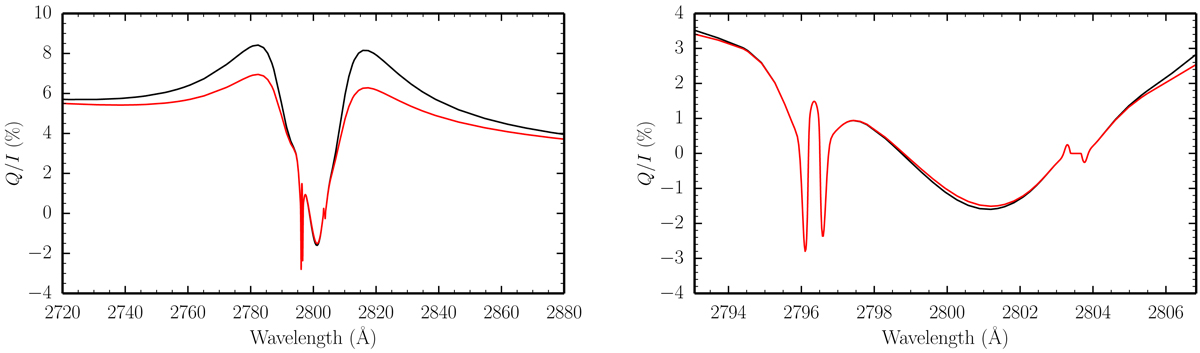
Fig. 7.
Download original image
Q/I profiles as a function of wavelength obtained from PRD calculations in the absence of a magnetic field, considering the wider (left panel) and narrower (right panel) spectral ranges discussed in the text. The black and red curves represent, respectively, the calculations carried out using the redistribution matrices given in Bommier (2017) and those given in Eq. (C.23), for which the main difference concerns the branching ratios.
Current usage metrics show cumulative count of Article Views (full-text article views including HTML views, PDF and ePub downloads, according to the available data) and Abstracts Views on Vision4Press platform.
Data correspond to usage on the plateform after 2015. The current usage metrics is available 48-96 hours after online publication and is updated daily on week days.
Initial download of the metrics may take a while.