Fig. 2.

Download original image
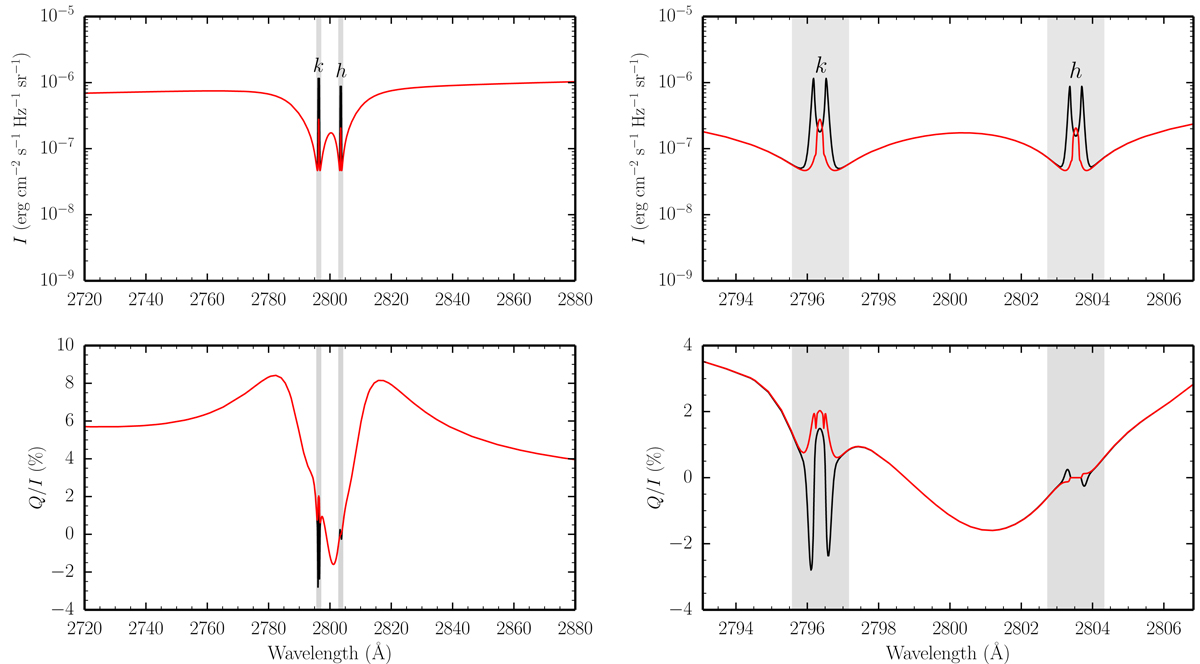
Stokes I (upper panels) and Q/I (lower panels) profiles as a function of wavelength for the Mg IIh & k lines for the wider (left panels) and narrower (right panels) spectral intervals discussed in the text. Vacuum wavelengths are considered for all figures. The calculations were carried out in the absence of a magnetic field. The solid black curves correspond to the reference PRD calculations (see text), whereas the solid red curves represent the results of calculations taking the approximate redistribution matrix ![]() (see text), in which scattering processes are treated as coherent in the reference frame of the observer. The shaded areas in the figures of this section are centered around the h & k lines, have a width of 1.6 Å, and indicate the spectral region where this approximation is not expected to be suitable. For all the figures presented in this section, the calculations are carried out considering the atmospheric model C of Fontenla et al. (1993). All profiles are presented for an LOS with μ = 0.1 and taking the direction for positive Stokes Q parallel to the limb.
(see text), in which scattering processes are treated as coherent in the reference frame of the observer. The shaded areas in the figures of this section are centered around the h & k lines, have a width of 1.6 Å, and indicate the spectral region where this approximation is not expected to be suitable. For all the figures presented in this section, the calculations are carried out considering the atmospheric model C of Fontenla et al. (1993). All profiles are presented for an LOS with μ = 0.1 and taking the direction for positive Stokes Q parallel to the limb.
Current usage metrics show cumulative count of Article Views (full-text article views including HTML views, PDF and ePub downloads, according to the available data) and Abstracts Views on Vision4Press platform.
Data correspond to usage on the plateform after 2015. The current usage metrics is available 48-96 hours after online publication and is updated daily on week days.
Initial download of the metrics may take a while.


