Fig. B.5.
Download original image
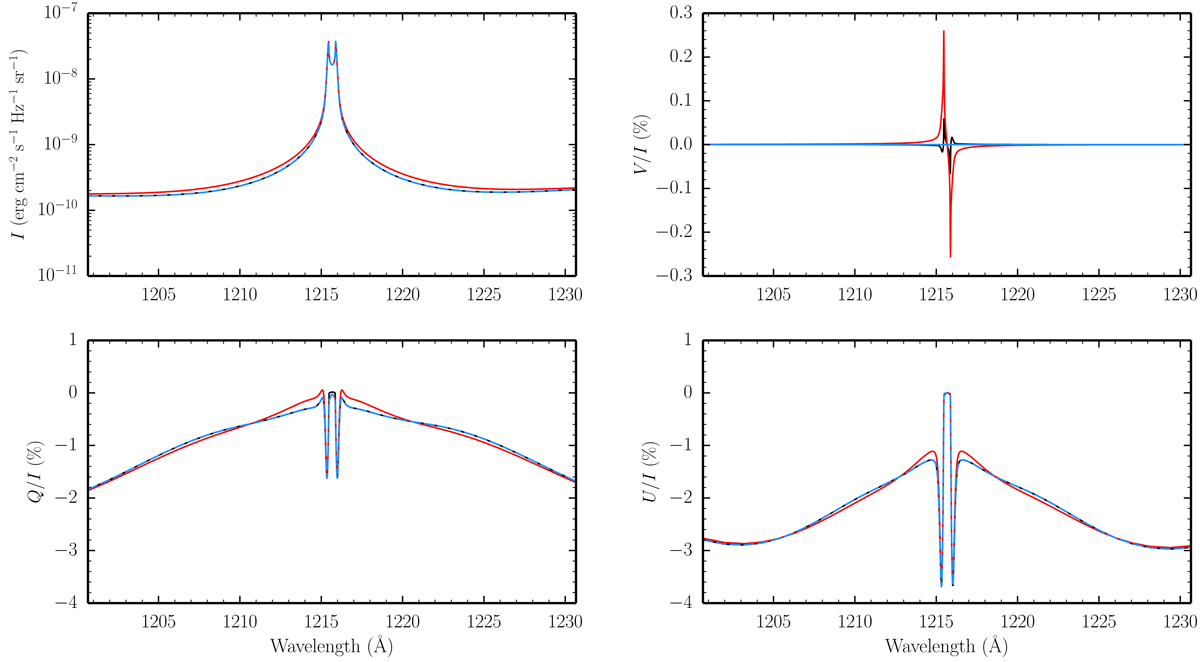
Intensity (upper left panel), V/I (upper right panel), Q/I (lower left panel), and U/I (lower right panel) profiles as a function of wavelength. The various colored curves show the results of reference PRD calculations in which the magnetic field is fully taken into account in all RT coefficients (black curves), neglecting its impact only in the computation of the emission coefficient (red curves), and accounting for it only for ηI and ρV (blue curves). The magnetic field is horizontal (θB = 90°) with χB = 0° and has a strength of 50 G.
Current usage metrics show cumulative count of Article Views (full-text article views including HTML views, PDF and ePub downloads, according to the available data) and Abstracts Views on Vision4Press platform.
Data correspond to usage on the plateform after 2015. The current usage metrics is available 48-96 hours after online publication and is updated daily on week days.
Initial download of the metrics may take a while.