Fig. 8
Download original image
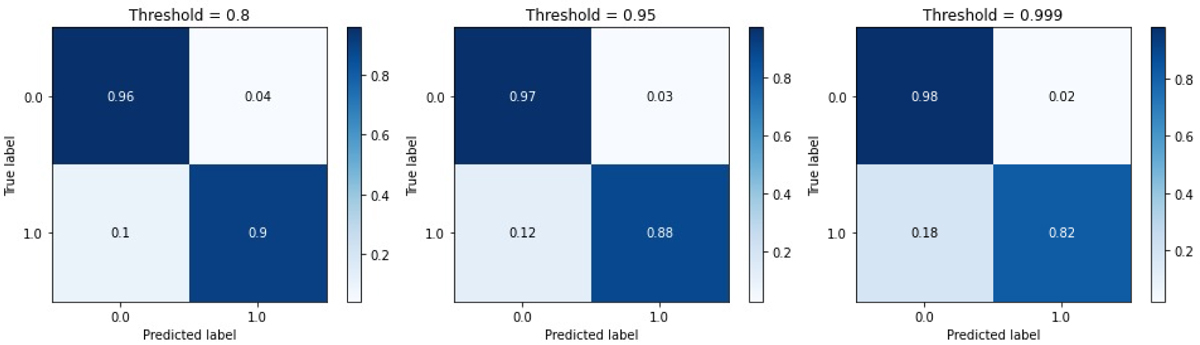
Confusion matrix of Lens Detector 15 plotted for various thresholds. Class 0 represents the non-lensed images, and Class 1 represents the lensed images. Lower right: square in each confusion matrix represents the true positives for which Lens Detector 15 identified strong lenses correctly. Upper left: square in each confusion matrix represents the true negatives for which Lens Detector 15 identified non-strong lenses correctly. Lower left: square in each confusion matrix represents the false negatives or the missed true lenses by Lens Detector 15. Upper right: square in each confusion matrix represents the false positives or the non-lenses identified by Lens Detector 15 as strong lenses.
Current usage metrics show cumulative count of Article Views (full-text article views including HTML views, PDF and ePub downloads, according to the available data) and Abstracts Views on Vision4Press platform.
Data correspond to usage on the plateform after 2015. The current usage metrics is available 48-96 hours after online publication and is updated daily on week days.
Initial download of the metrics may take a while.