Open Access
Fig. 11
Download original image
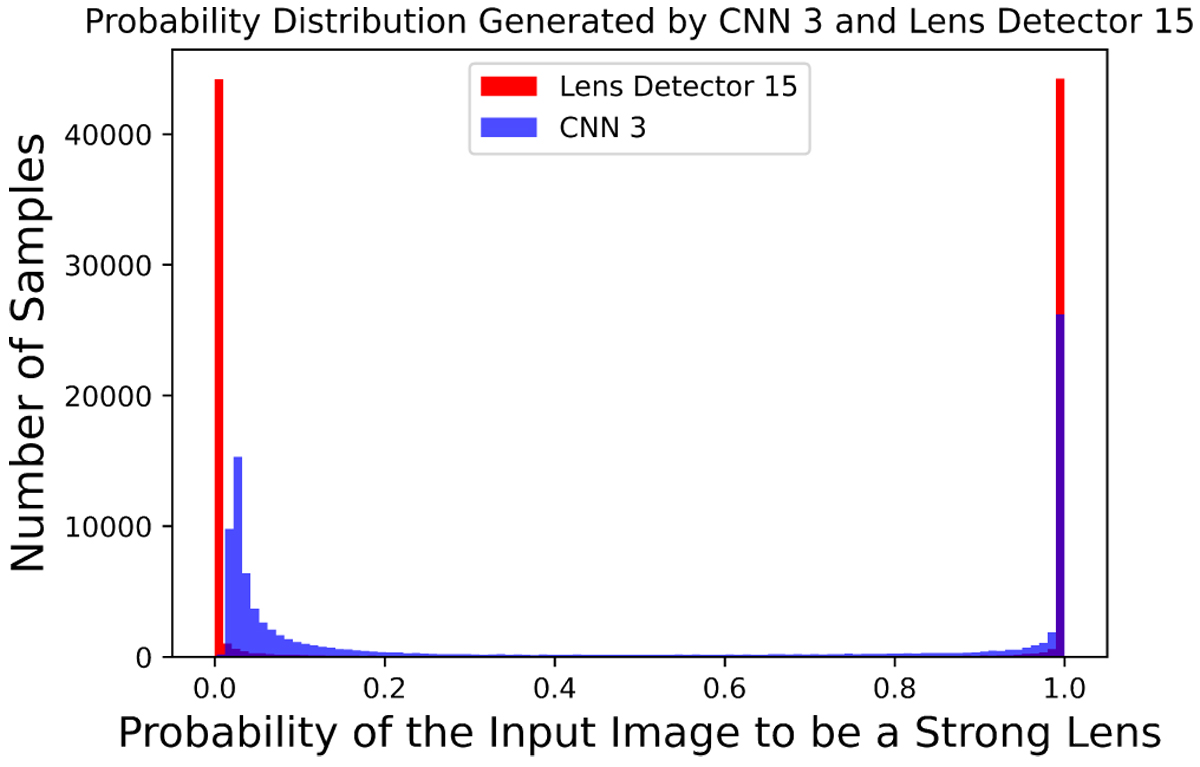
Comparison of the output probabilities of CNN 3 and Lens Detector 15 for the ground-based challenge dataset. In this histogram values leaning towards zero represent the lack of a strong lens in the image, and values leaning towards one indicate the presence of a strong lens in the image.
Current usage metrics show cumulative count of Article Views (full-text article views including HTML views, PDF and ePub downloads, according to the available data) and Abstracts Views on Vision4Press platform.
Data correspond to usage on the plateform after 2015. The current usage metrics is available 48-96 hours after online publication and is updated daily on week days.
Initial download of the metrics may take a while.