Fig. 9
Download original image
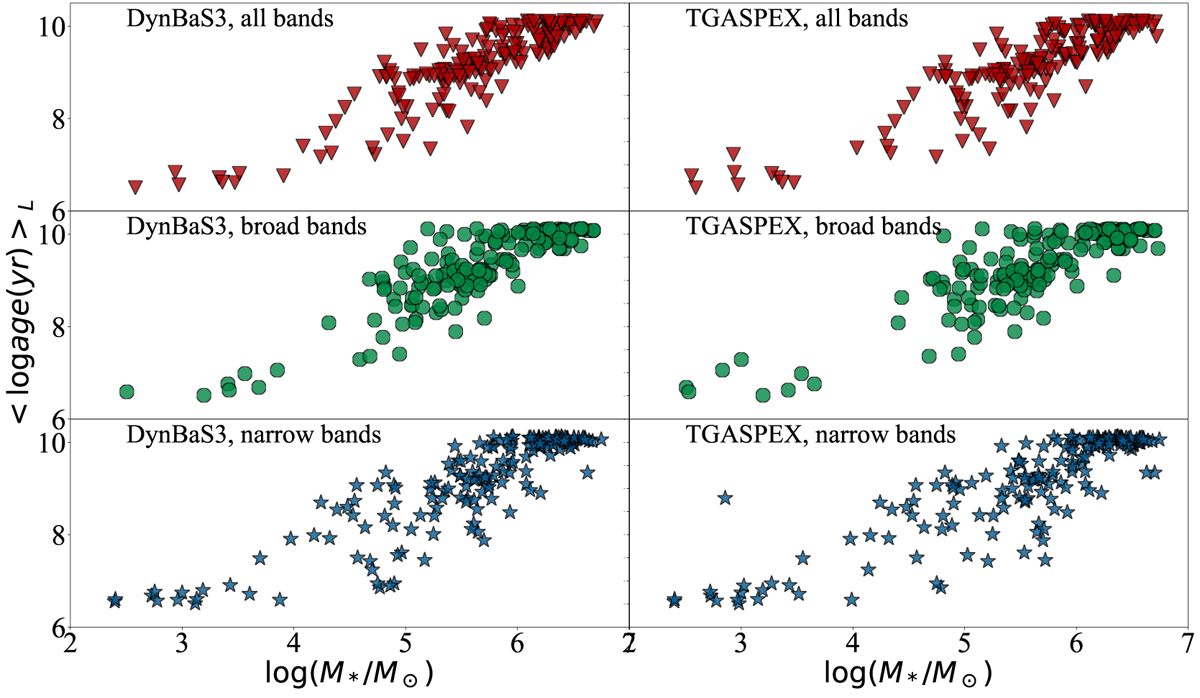
Correlation between ages and masses derived via SED fitting. A trend where the mean ages of the cluster-candidates increase with stellar masses is seen for all combinations of code and filter set. Left and right panels: illustrate the results for DynBaS 3 and TGASPEX, respectively. Red triangles represent results obtained using all bands, green circles represent results when using only the broadband, and blue stars represent results obtained from the narrowband only.
Current usage metrics show cumulative count of Article Views (full-text article views including HTML views, PDF and ePub downloads, according to the available data) and Abstracts Views on Vision4Press platform.
Data correspond to usage on the plateform after 2015. The current usage metrics is available 48-96 hours after online publication and is updated daily on week days.
Initial download of the metrics may take a while.