Fig. 8
Download original image
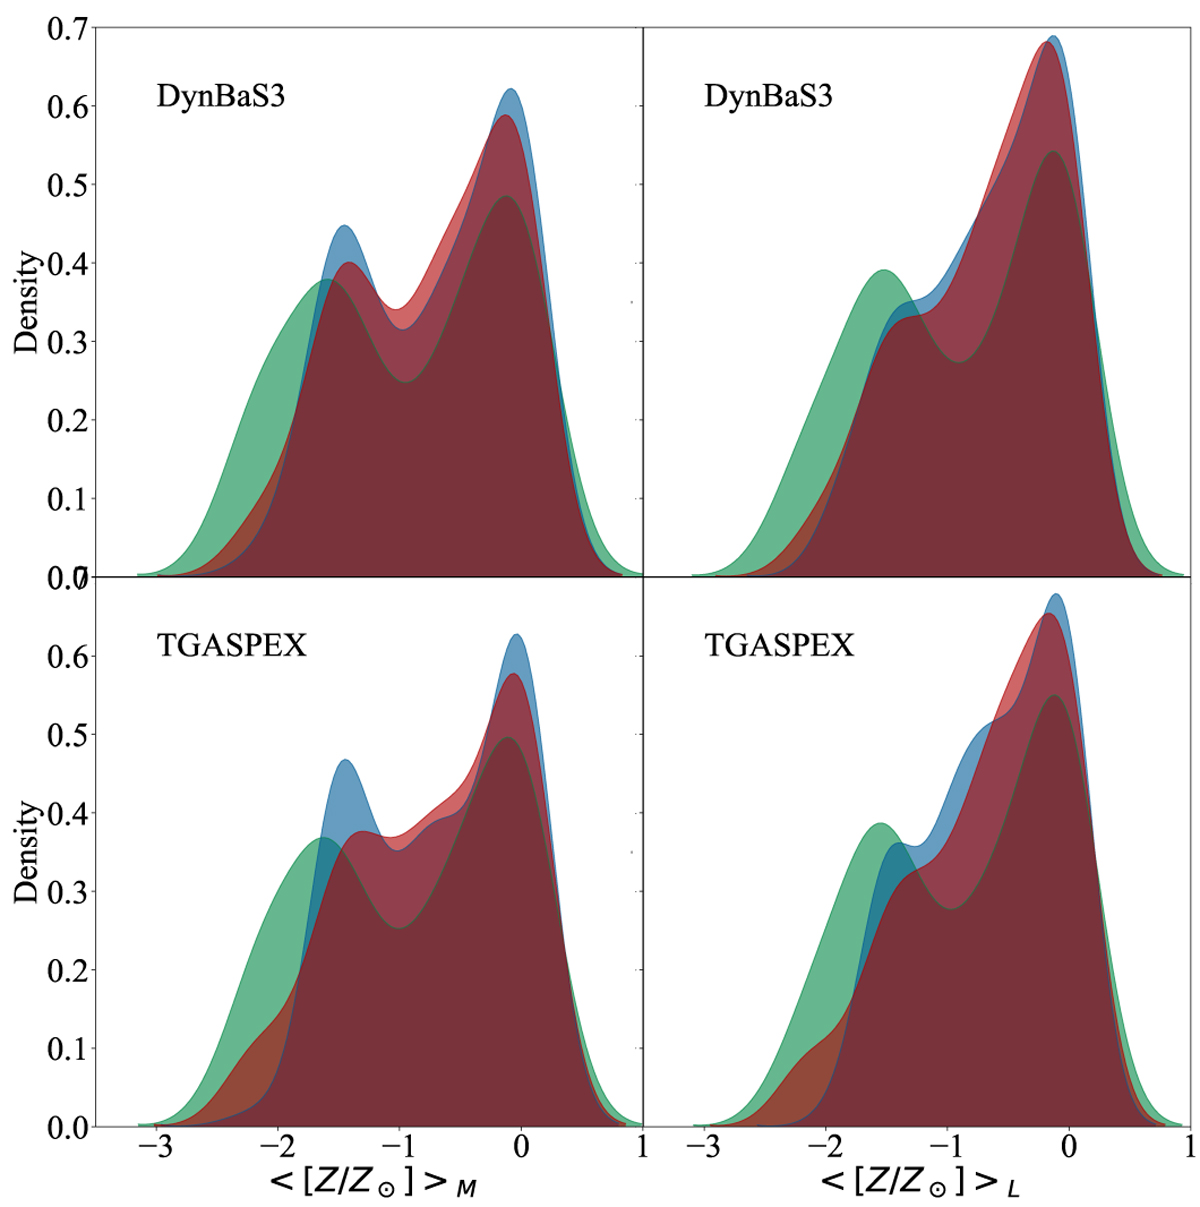
Distribution of metallicities obtained from SED fitting. Upper and lower panels: illustrate results for DynBaS 3 and TGASPEX respectively. Left and right panels: results for mass- and light-weighted Z, respectively. Red represents results obtained using all available filters. Green represents results obtained using broadband filters only. Blue represents results obtained using narrowband filters only.
Current usage metrics show cumulative count of Article Views (full-text article views including HTML views, PDF and ePub downloads, according to the available data) and Abstracts Views on Vision4Press platform.
Data correspond to usage on the plateform after 2015. The current usage metrics is available 48-96 hours after online publication and is updated daily on week days.
Initial download of the metrics may take a while.