Fig. 4
Download original image
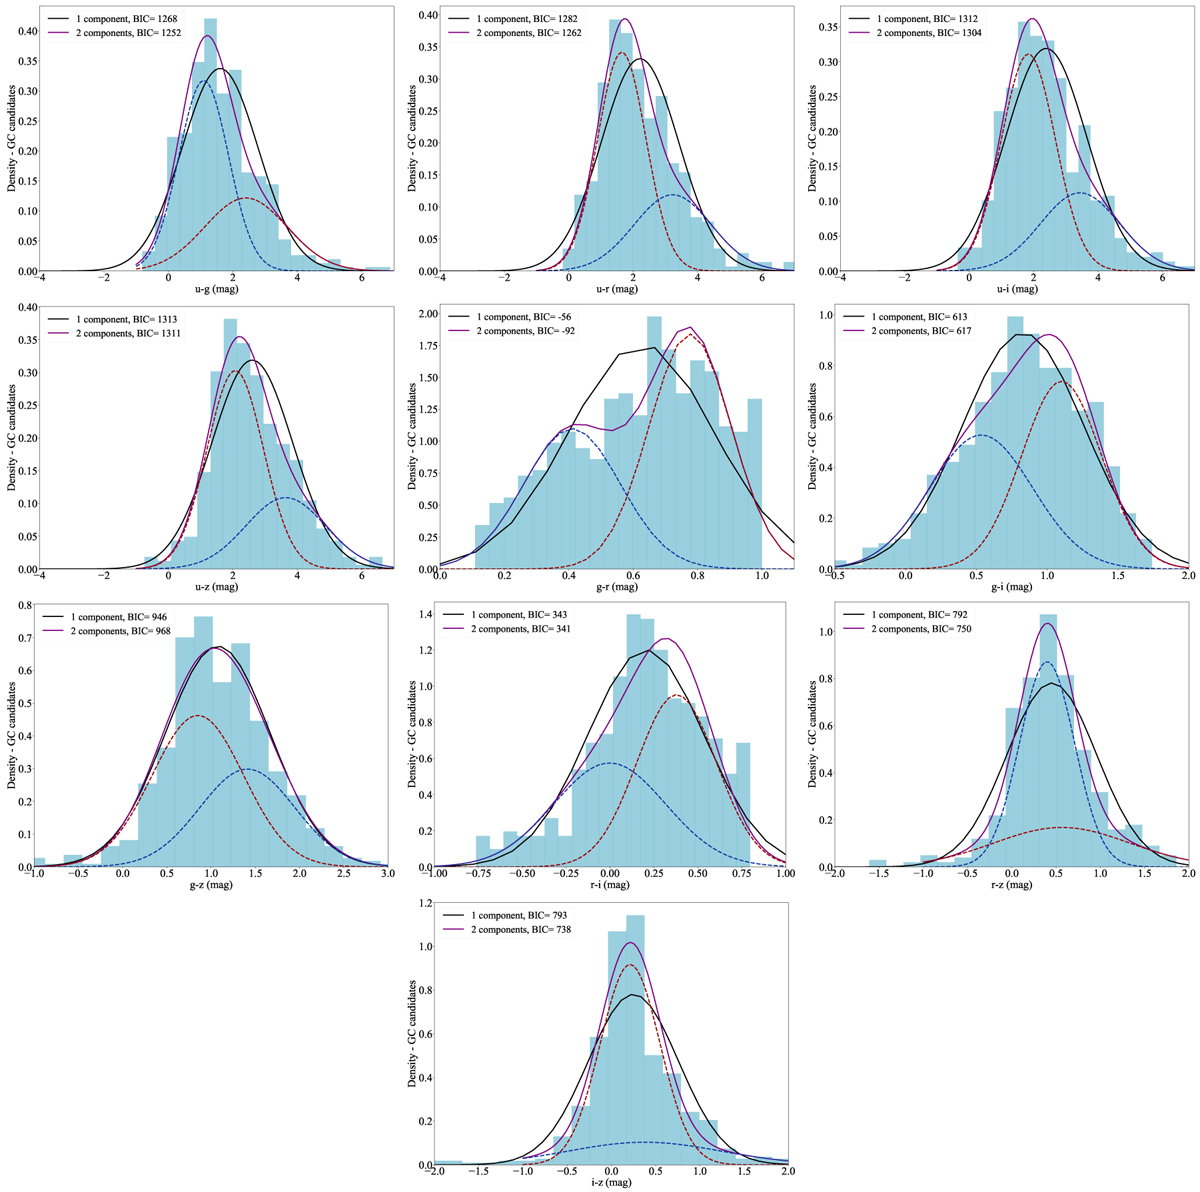
Color distribution computed using broad-band filters only. The curves represent the unimodal (black) and bimodal (purple) distributions returned by the GMM analysis. We also show in blue and red dashed lines the two peaks that compose the bimodal distribution. BICs values for GMM with one and two components are shown as an example.
Current usage metrics show cumulative count of Article Views (full-text article views including HTML views, PDF and ePub downloads, according to the available data) and Abstracts Views on Vision4Press platform.
Data correspond to usage on the plateform after 2015. The current usage metrics is available 48-96 hours after online publication and is updated daily on week days.
Initial download of the metrics may take a while.