Fig. C.3
Download original image
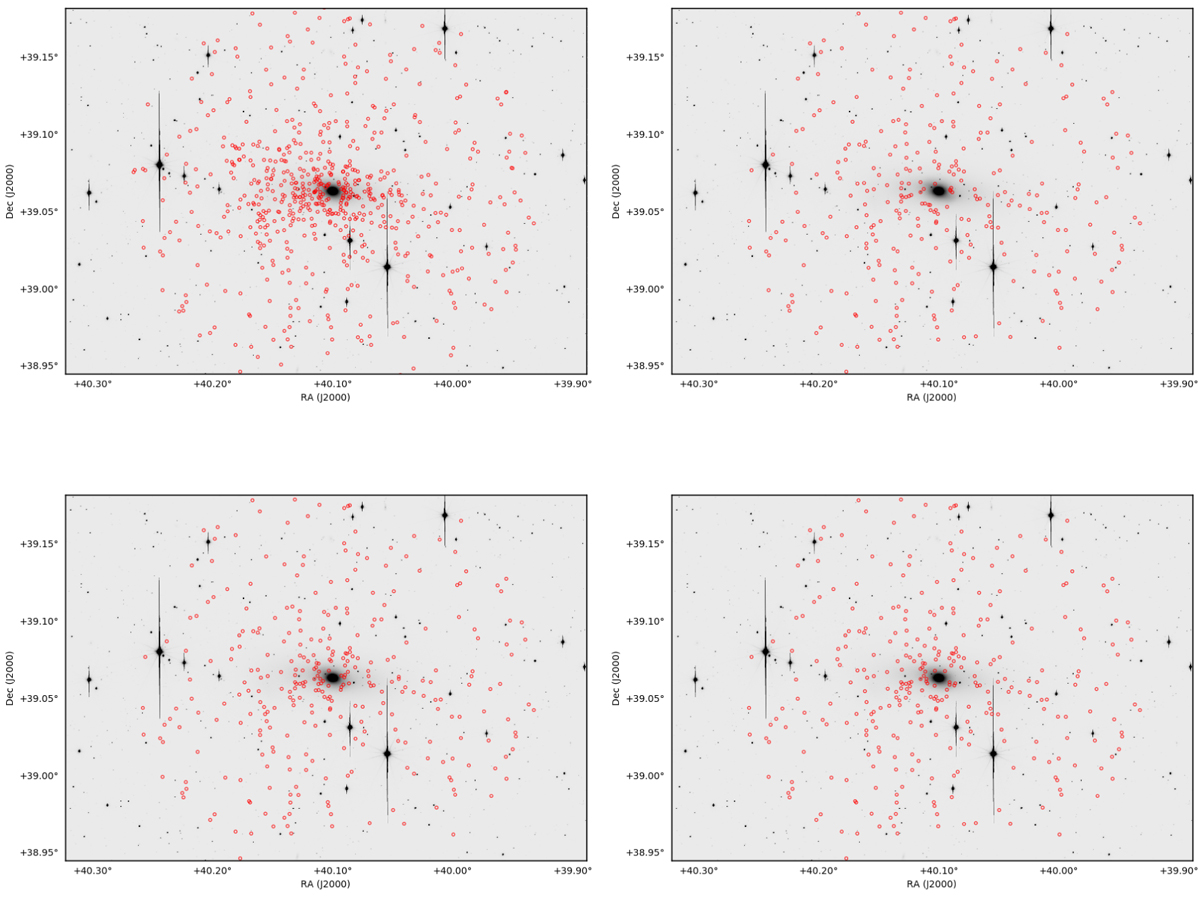
Comparison of applied methods. Top left panel: GCs present in the reference catalog from Kartha et al. (2014). Top right panel: GCs detected using the Source Extractor method that are also presented in Kartha et al. (2014). Bottom left panel: GCs detected using the median smoothing method that are also found in Kartha et al. (2014). Bottom right panel: Objects detected using ISOFIT and CMODEL method (Ciambur 2015) that are also reported in Kartha et al. (2014). In the background we show the white image of NGC 1023 used for the detection of sources. FoV is ≈ 0.1 deg2.
Current usage metrics show cumulative count of Article Views (full-text article views including HTML views, PDF and ePub downloads, according to the available data) and Abstracts Views on Vision4Press platform.
Data correspond to usage on the plateform after 2015. The current usage metrics is available 48-96 hours after online publication and is updated daily on week days.
Initial download of the metrics may take a while.