Open Access
Fig. 2
Download original image
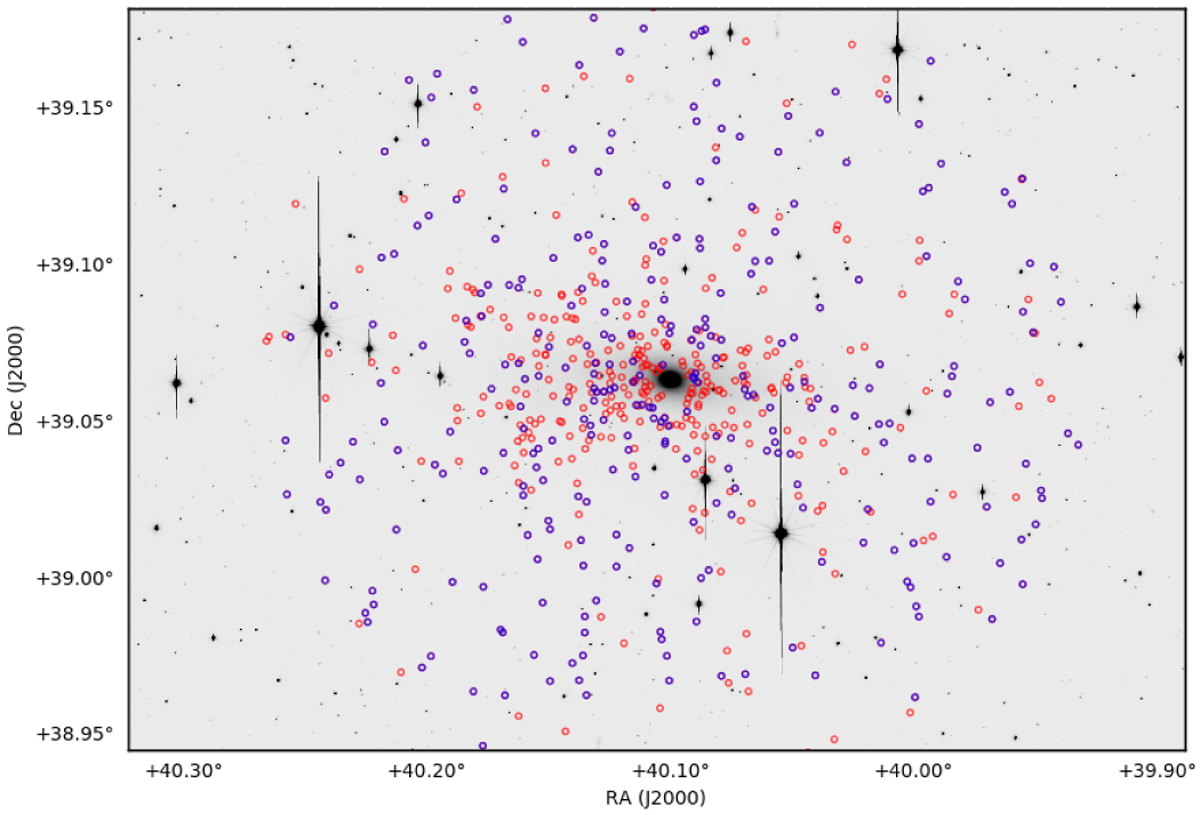
Spatial distribution of GC candidates. In the background we show the white image of NGC 1023 used for the detection of sources. The FoV is ≈0.1 deg2. Red circles represent GC candidates from the reference catalog (Kartha et al. 2014). Blue circles represent GCs in common between GCFinder selection and the reference catalog.
Current usage metrics show cumulative count of Article Views (full-text article views including HTML views, PDF and ePub downloads, according to the available data) and Abstracts Views on Vision4Press platform.
Data correspond to usage on the plateform after 2015. The current usage metrics is available 48-96 hours after online publication and is updated daily on week days.
Initial download of the metrics may take a while.