Open Access
Fig. A.5
Download original image
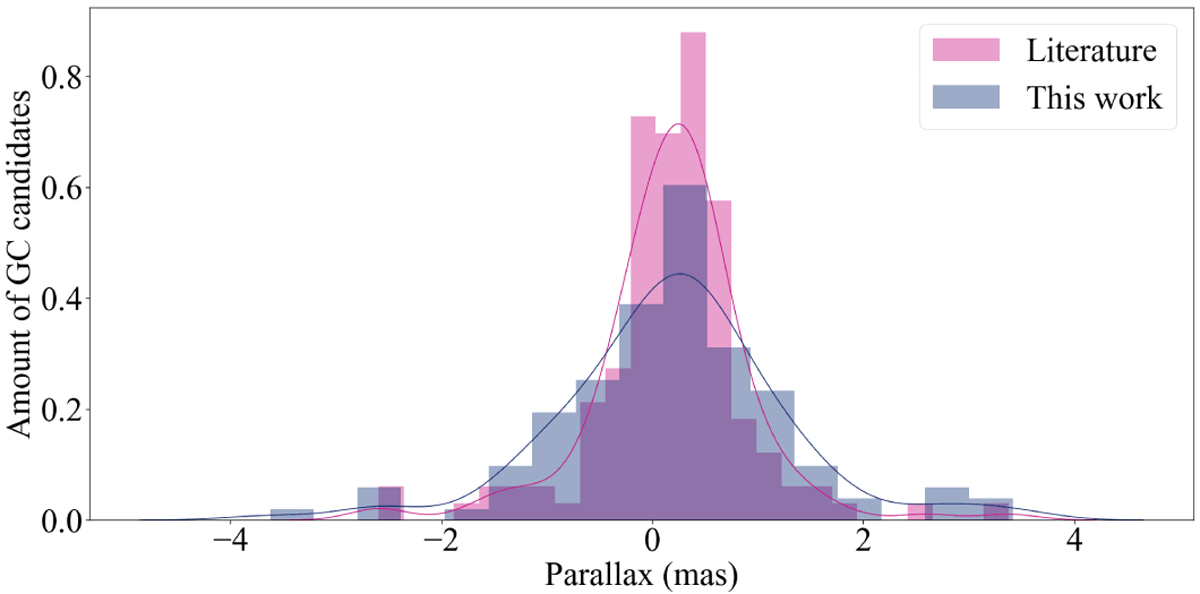
Distribution of parallaxes for the GC candidates as obtained from Gaia EDR3. The blue distribution corresponds to the candidates of the present wok and magenta shows the distribution of GC candidates identified by Kartha et al. (2014).
Current usage metrics show cumulative count of Article Views (full-text article views including HTML views, PDF and ePub downloads, according to the available data) and Abstracts Views on Vision4Press platform.
Data correspond to usage on the plateform after 2015. The current usage metrics is available 48-96 hours after online publication and is updated daily on week days.
Initial download of the metrics may take a while.