Open Access
Fig. 12
Download original image
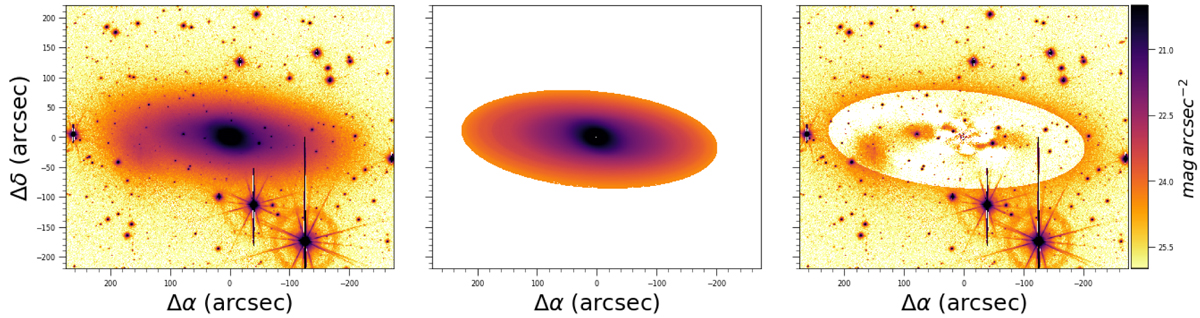
Photometric model for NGC 1023. Left panel: R-band image. Middle panel: ellipse model. Right panel: residual map, with NGC 1023A revealed, together with two spiral arms and an inner bar.
Current usage metrics show cumulative count of Article Views (full-text article views including HTML views, PDF and ePub downloads, according to the available data) and Abstracts Views on Vision4Press platform.
Data correspond to usage on the plateform after 2015. The current usage metrics is available 48-96 hours after online publication and is updated daily on week days.
Initial download of the metrics may take a while.