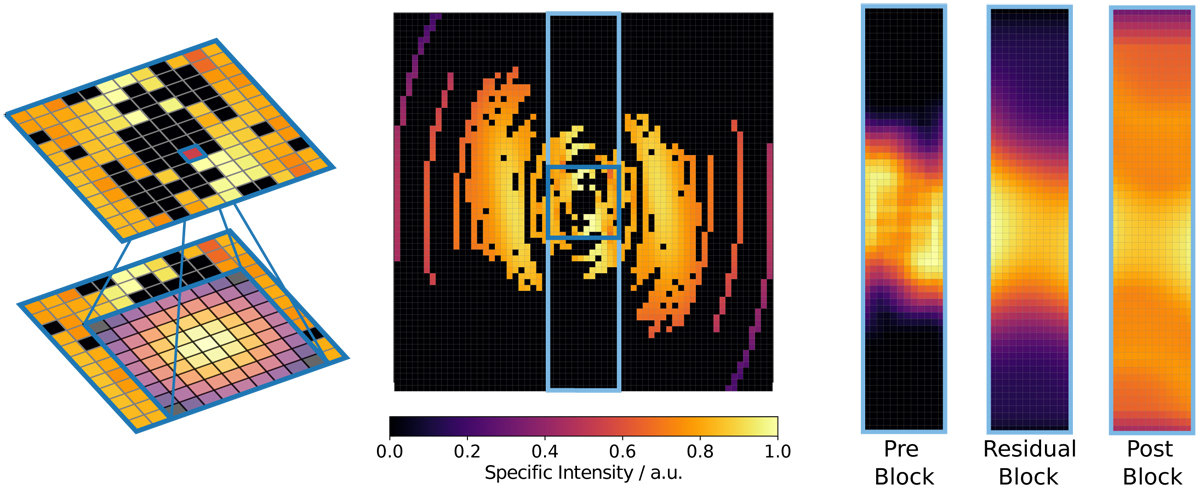
Fig. 7
Download original image
Schematic illustration how our neural network reconstructs incomplete amplitude and phase maps. Frequels with missing information have values of zero. Convolutions inside the architecture use information of neighboring frequels to calculate a new value for the center frequel. A convolution with a (9 × 9) kernel is shown on the left (dark-blue). An input amplitude map is shown in the middle. The part of the map used for the convolution example is marked with dark-blue. The part marked in light-blue is used to demonstrate the reconstruction progress after the different network stages. The reconstruction status after the Pre Block, Residual Block and Post Block is shown on the right. The amount of frequels without information decreases after every stage. The amplitude map is reconstructed up to the edges when it has passed through the Post Block. For simplicity, only the influence of the convolutions is taken into account. A re-scaling of the output of the different stages was performed for better visualization.
Current usage metrics show cumulative count of Article Views (full-text article views including HTML views, PDF and ePub downloads, according to the available data) and Abstracts Views on Vision4Press platform.
Data correspond to usage on the plateform after 2015. The current usage metrics is available 48-96 hours after online publication and is updated daily on week days.
Initial download of the metrics may take a while.