Fig. 2
Download original image
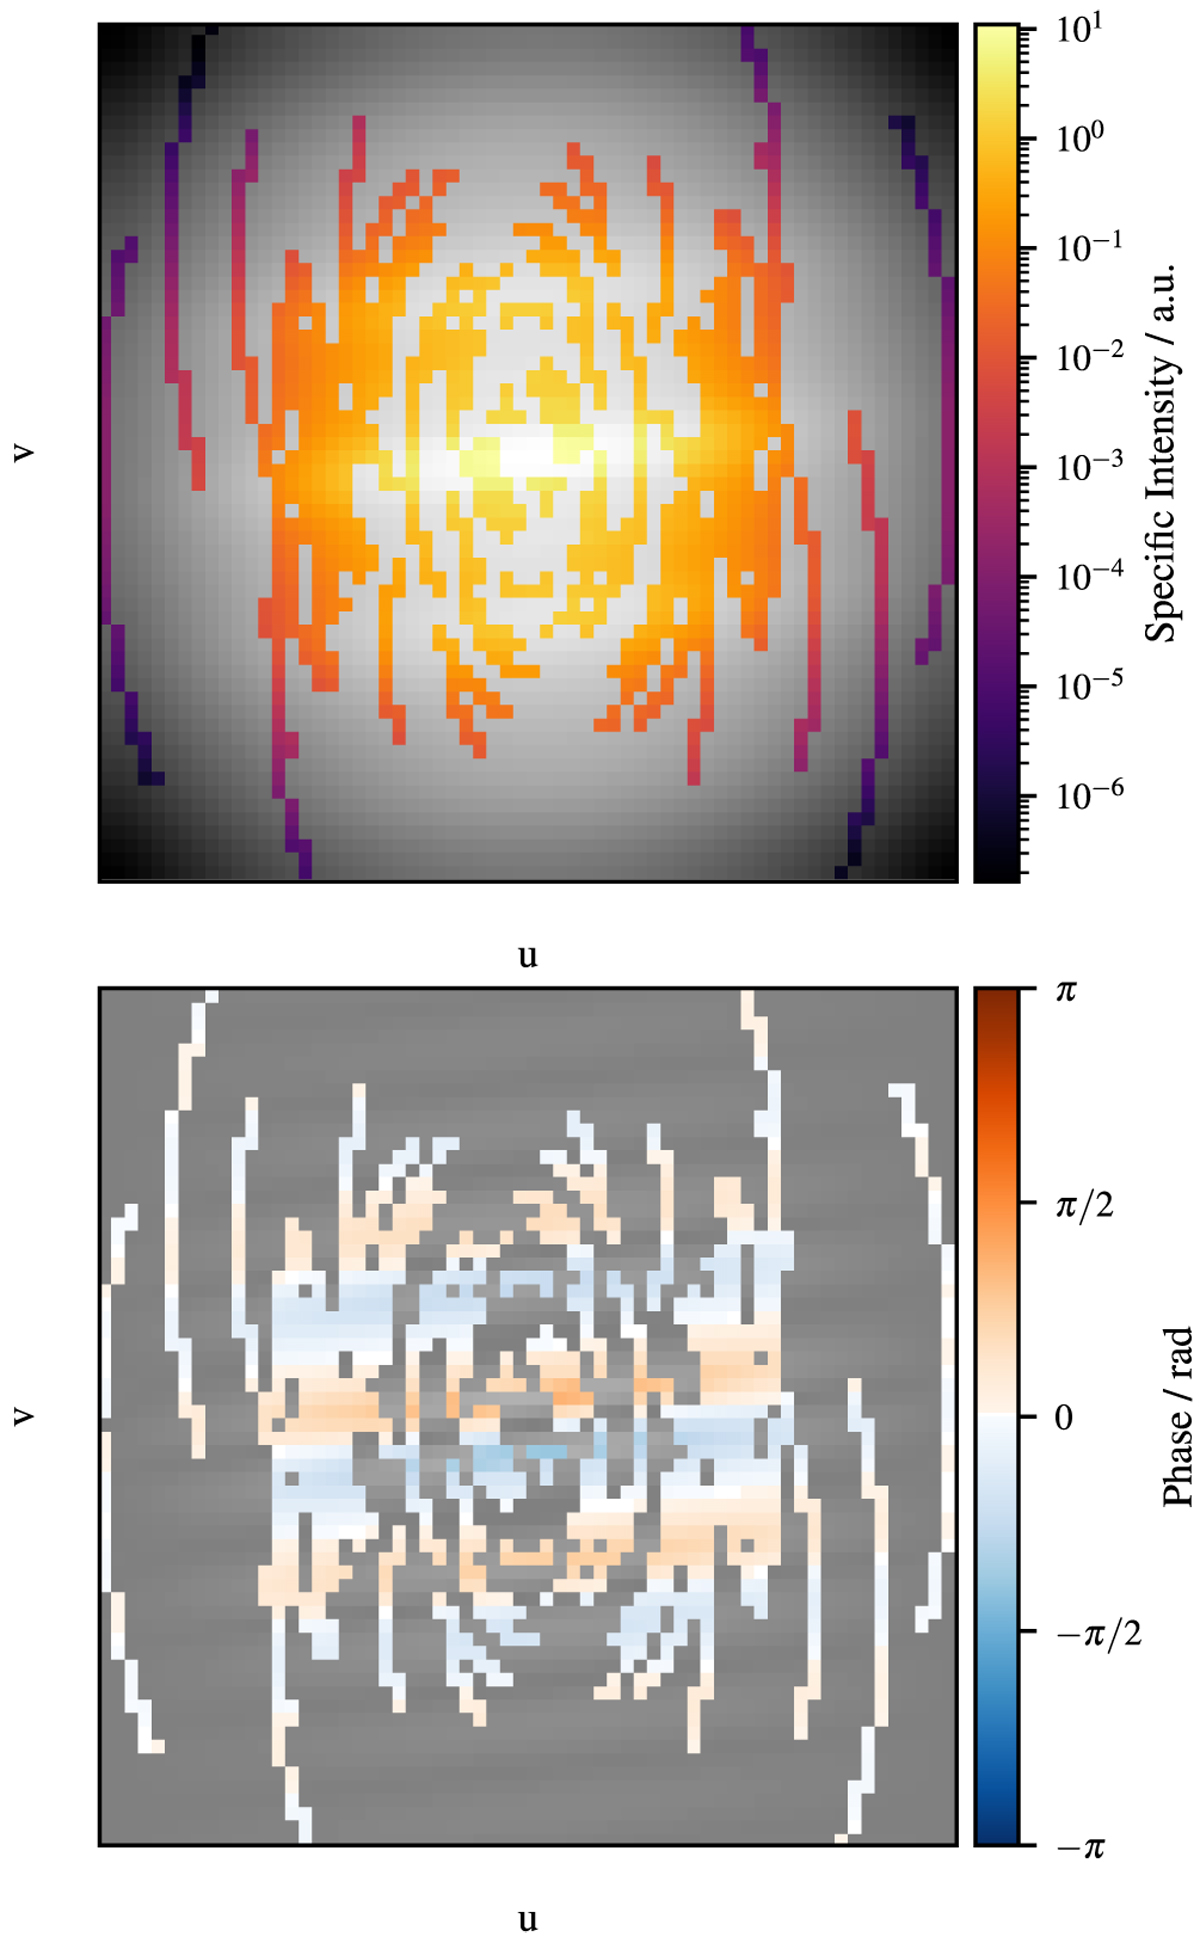
Amplitude (top) and phase (bottom) of the simulated radio galaxy. In the first step, the representation of the radio galaxy in Fourier space was calculated by Fourier transform. Then the complex values were transformed to amplitude and phase utilizing Euler’s formula. To mimic an observation with a radio interferometer, the images were sampled using the (u, v) coverage of a simulated observation with the VLBA. The remaining information is displayed in color, all dropped information is grayed out.
Current usage metrics show cumulative count of Article Views (full-text article views including HTML views, PDF and ePub downloads, according to the available data) and Abstracts Views on Vision4Press platform.
Data correspond to usage on the plateform after 2015. The current usage metrics is available 48-96 hours after online publication and is updated daily on week days.
Initial download of the metrics may take a while.