Fig. 18
Download original image
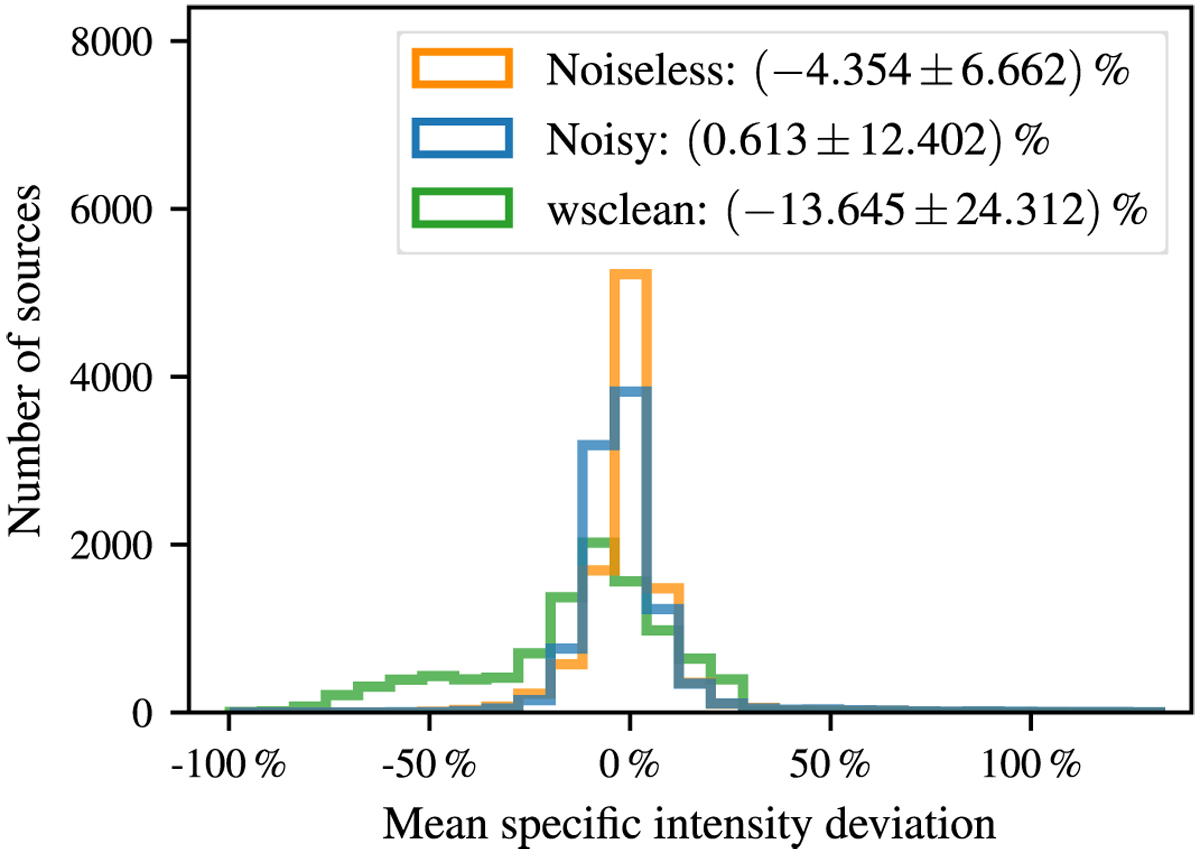
Histogram of the mean specific intensity deviation in the core component for a deep learning model trained with noiseless (orange), one trained with noisy input data (blue) and clean images generated with wsclean (green). The results are near the optimal value of zero on a similar level, although there are some outliers, which is represented by the relatively high standard deviation. For wsclean the peak is shifted slightly into the negative values, which indicates a slight underestimation of the flux densities.
Current usage metrics show cumulative count of Article Views (full-text article views including HTML views, PDF and ePub downloads, according to the available data) and Abstracts Views on Vision4Press platform.
Data correspond to usage on the plateform after 2015. The current usage metrics is available 48-96 hours after online publication and is updated daily on week days.
Initial download of the metrics may take a while.