Fig. 16
Download original image
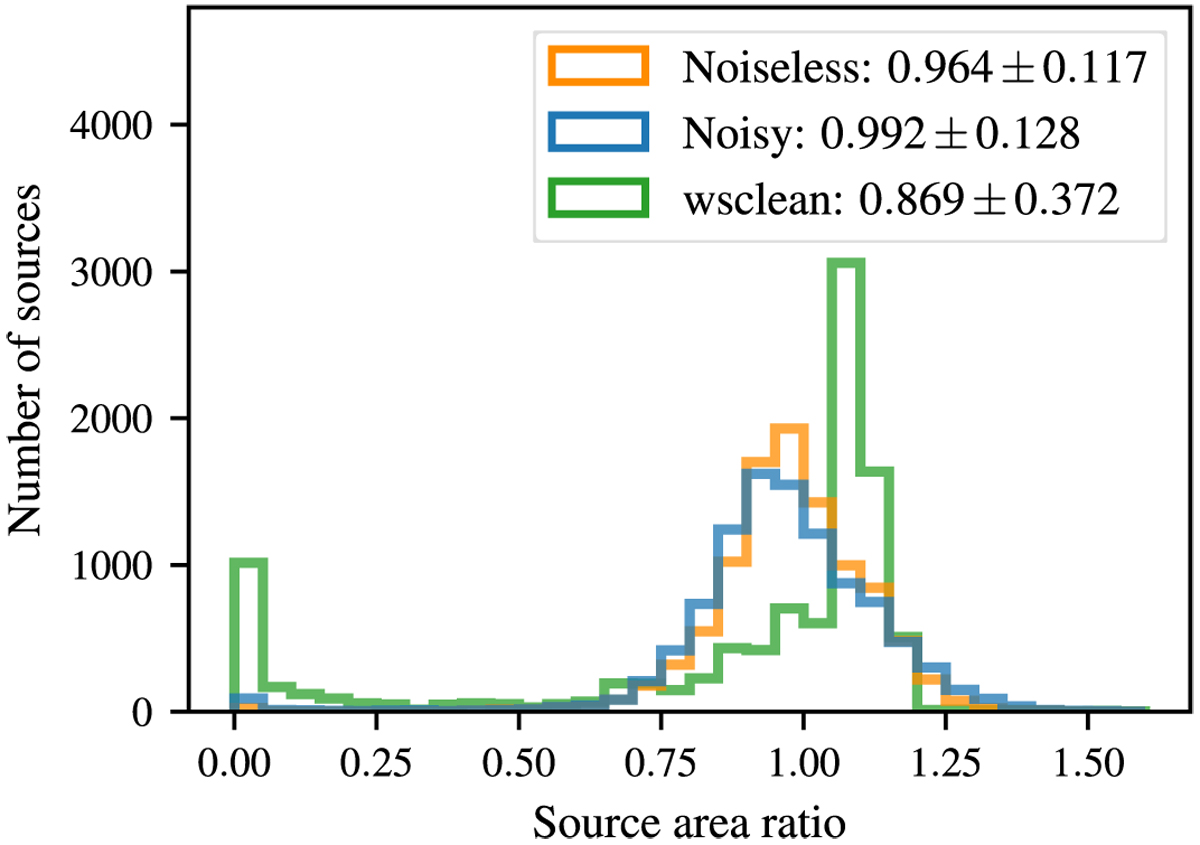
Histogram of the source area ratios between prediction and truth. Results for a deep learning model trained with noiseless (orange), one trained with noisy input data (blue) and clean images generated with wsclean (green) are displayed. It becomes clear, that the distributions match well, which is supported by the mean and the standard deviation. In the case of wsclean a small overestimation of the area is visible.
Current usage metrics show cumulative count of Article Views (full-text article views including HTML views, PDF and ePub downloads, according to the available data) and Abstracts Views on Vision4Press platform.
Data correspond to usage on the plateform after 2015. The current usage metrics is available 48-96 hours after online publication and is updated daily on week days.
Initial download of the metrics may take a while.