Fig. 6.
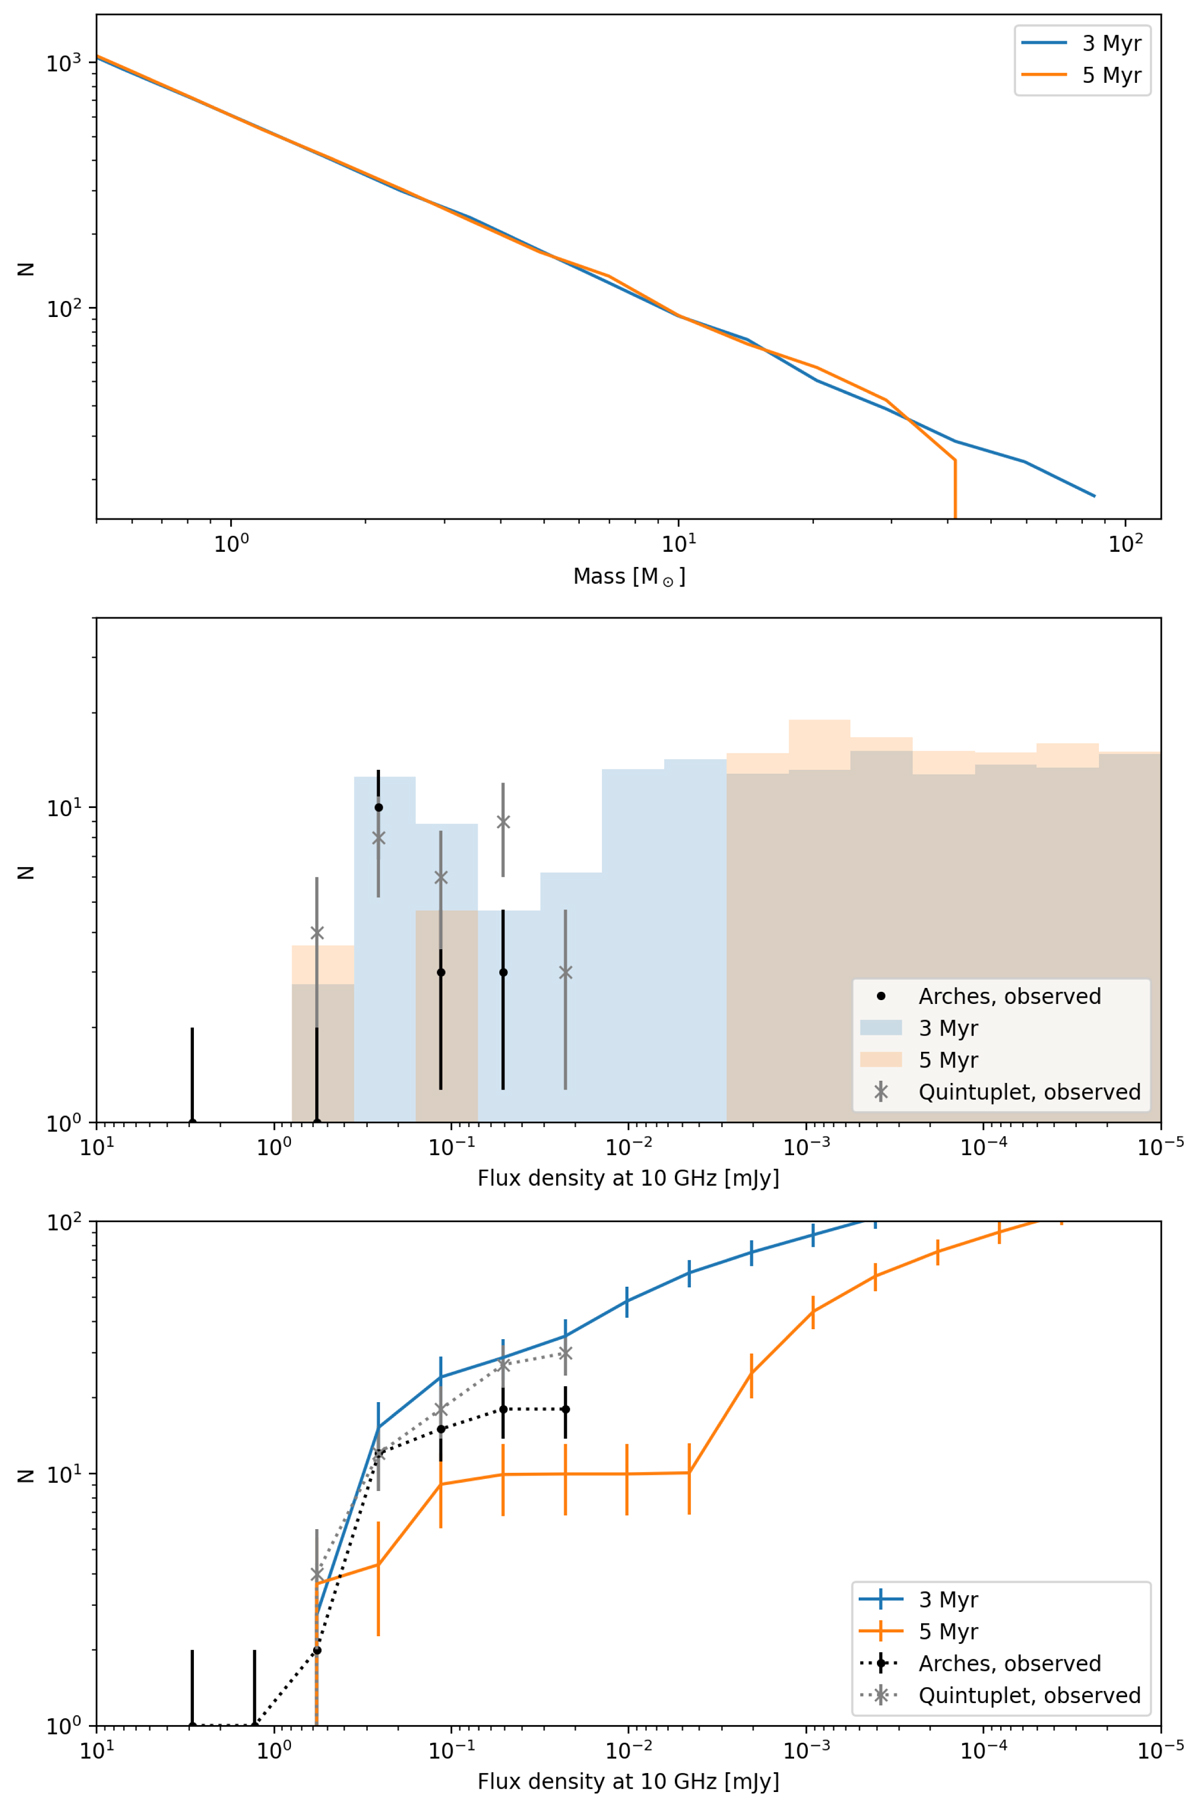
Download original image
Radio flux densities of massive stars in a model cluster, using MIST isochrones. Top: present-day mas function. Middle: histograms of predicted radio flux densities. Bottom: cumulative histograms of predicted radio flux densities. The black histogram corresponds to the observed data for the Arches cluster (Gallego-Calvente et al. 2021, dotted) and the grey histogram to the observed data for the Quintuplet cluster (this work, solid).
Current usage metrics show cumulative count of Article Views (full-text article views including HTML views, PDF and ePub downloads, according to the available data) and Abstracts Views on Vision4Press platform.
Data correspond to usage on the plateform after 2015. The current usage metrics is available 48-96 hours after online publication and is updated daily on week days.
Initial download of the metrics may take a while.