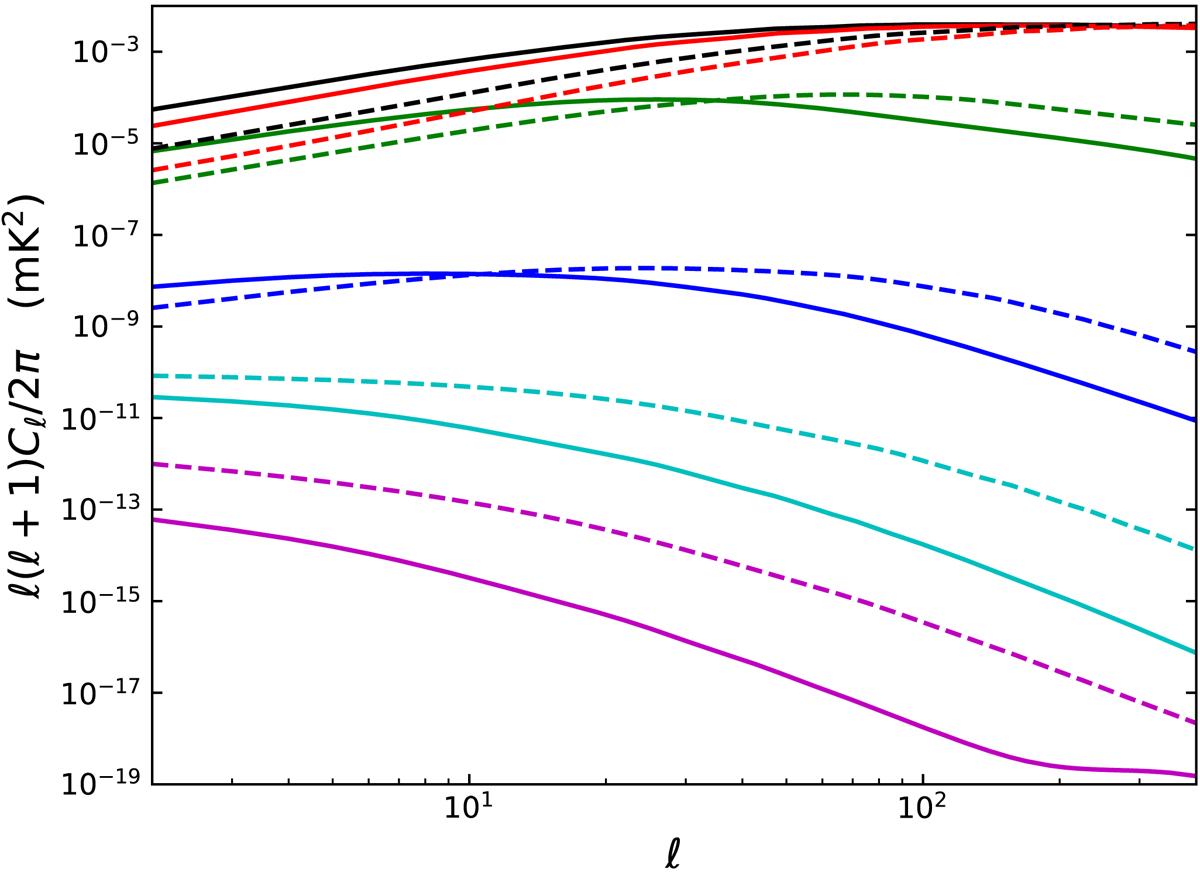
Fig. 1.
Download original image
Brightness temperature perturbation power spectrum at z = 0.13 (solid lines) and z = 0.45 (dashed lines) with a 9.33 MHz bandwidth. The auto-spectra of the full signal (black) and of each individual term are shown, generically grouped as Newtonian-gauge density (red), redshift-space distortions (green), velocity term (blue), all potential terms evaluated at the source position (cyan), and the ISW component (magenta). The power spectrum is dominated by the H I overdensity at small scales and has a significant contribution from RSD at large scales.
Current usage metrics show cumulative count of Article Views (full-text article views including HTML views, PDF and ePub downloads, according to the available data) and Abstracts Views on Vision4Press platform.
Data correspond to usage on the plateform after 2015. The current usage metrics is available 48-96 hours after online publication and is updated daily on week days.
Initial download of the metrics may take a while.