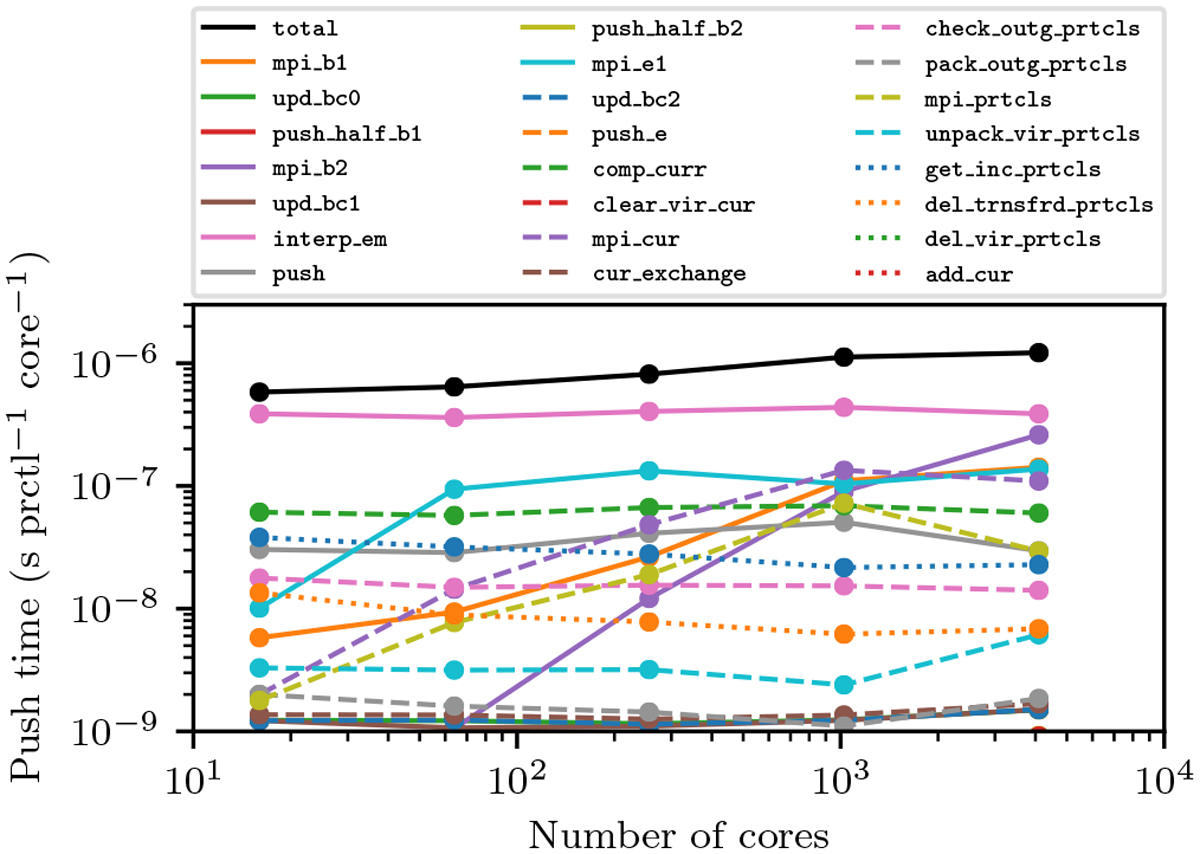
Fig. 6
Download original image
Weak scaling results of the PIC code measured in a strongly load-imbalanced simulation state. Scaling is presented in terms of the mean particle push time per processor for various simulations that have a fixed ratio of total number of particles to processors. The black line shows the total mean push time; the other curves show the individual results for each component in the loop (see Table 1). Ideal scaling corresponds to a horizontal line, although there is a slight increase in the evaluation time due to more time spent on communication routines as the number of processors increases.
Current usage metrics show cumulative count of Article Views (full-text article views including HTML views, PDF and ePub downloads, according to the available data) and Abstracts Views on Vision4Press platform.
Data correspond to usage on the plateform after 2015. The current usage metrics is available 48-96 hours after online publication and is updated daily on week days.
Initial download of the metrics may take a while.