Fig. 4
Download original image
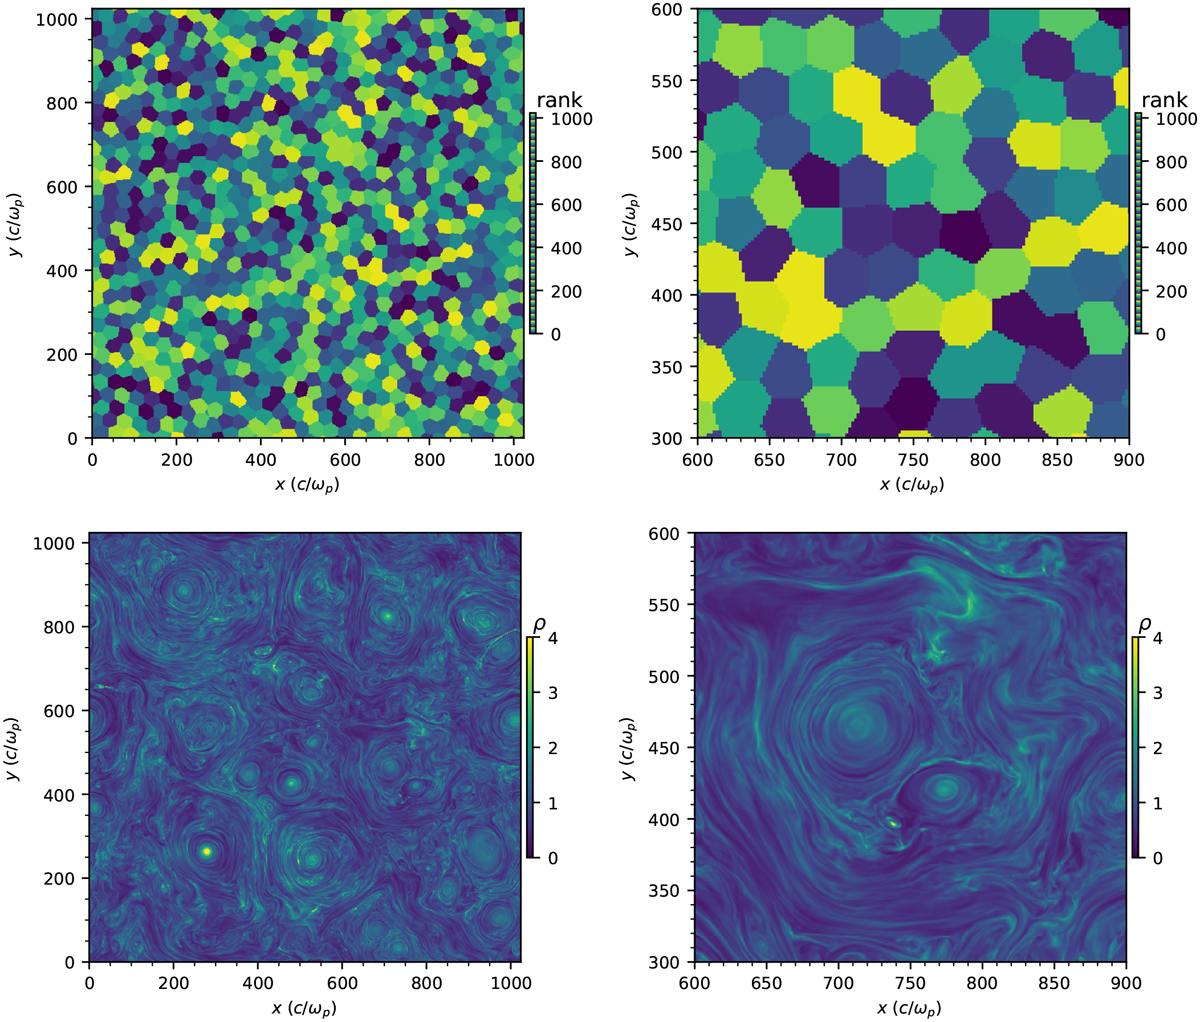
Visualizations of the kinetic turbulence simulations. The top row shows the honeycomb-like domain decomposition that partitions the grid between different processors with the CORGI library (the color map is cyclic). The bottom row shows the plasma density (in units of the initial plasma mass density ρ0). The left panels show the full simulation domain, whereas the right panels focus on a smaller subregion that better illustrates the small-scale structures.
Current usage metrics show cumulative count of Article Views (full-text article views including HTML views, PDF and ePub downloads, according to the available data) and Abstracts Views on Vision4Press platform.
Data correspond to usage on the plateform after 2015. The current usage metrics is available 48-96 hours after online publication and is updated daily on week days.
Initial download of the metrics may take a while.