Fig. 3
Download original image
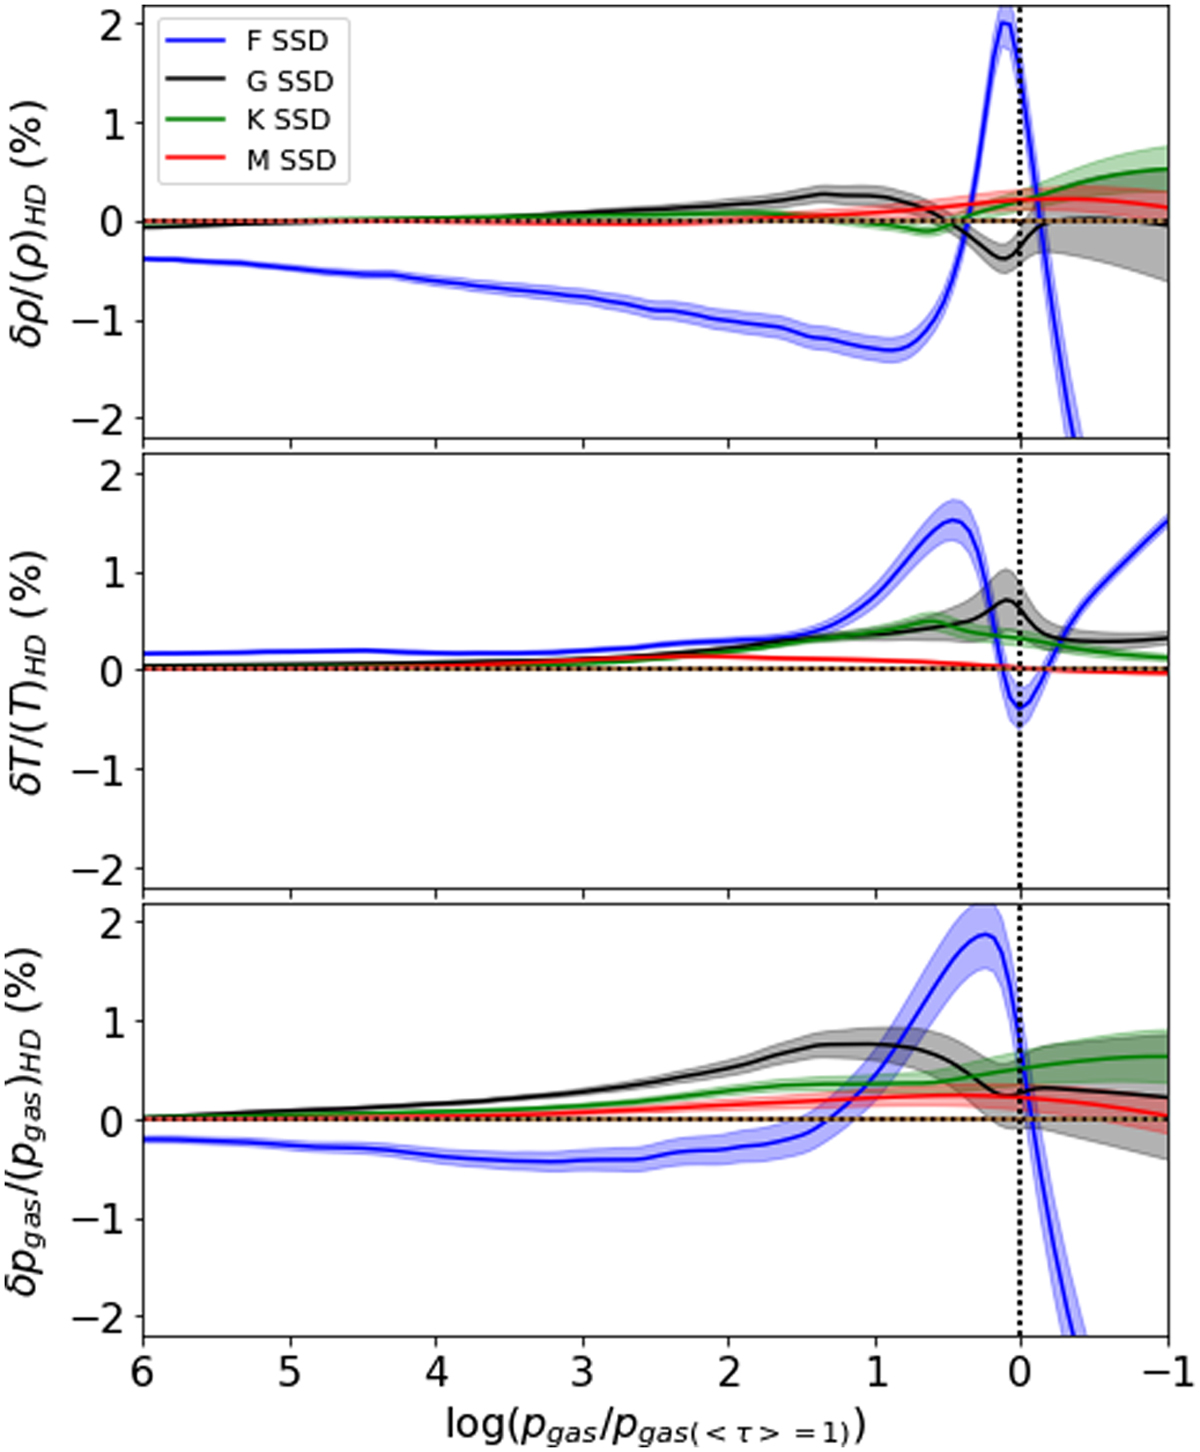
Deviations in ρ, T, and pgas for F (blue), G (black), K (green), and M-star (red) cases. The vertical axis gives the geometric deviations as a percentage relative to the hydrodynamic case. The horizontal axis is the number of pressure scale heights log10(pgas/pgas(τ=1)), calculated for the HD cases, below the surface (dotted vertical black line). The shaded regions correspond to 1-σ standard error ![]() , N is the number of snapshots) of the mean solid curve.
, N is the number of snapshots) of the mean solid curve.
Current usage metrics show cumulative count of Article Views (full-text article views including HTML views, PDF and ePub downloads, according to the available data) and Abstracts Views on Vision4Press platform.
Data correspond to usage on the plateform after 2015. The current usage metrics is available 48-96 hours after online publication and is updated daily on week days.
Initial download of the metrics may take a while.