Fig. 6.
Download original image
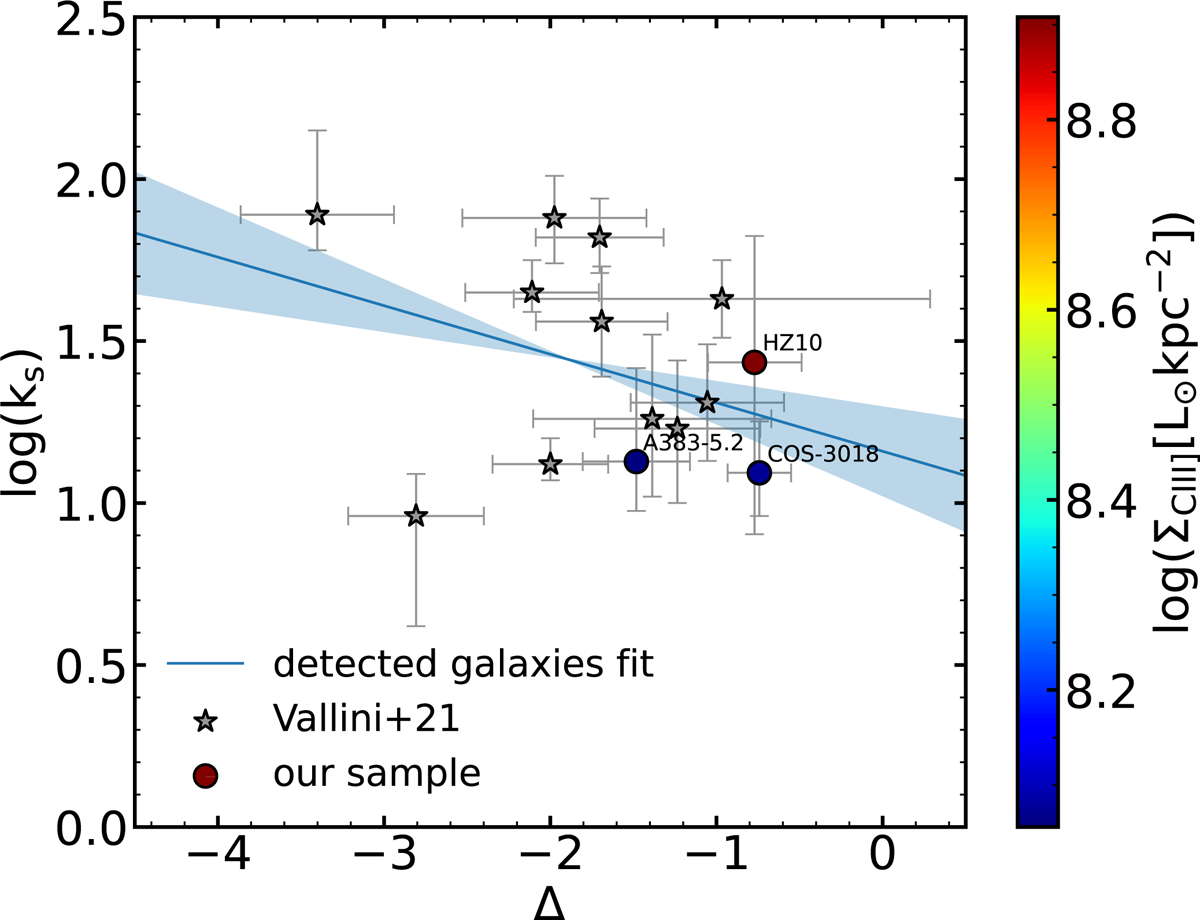
Burstiness parameter κs vs. deviation from the local De-Looze relation Δ, color-coded by the C III] surface brightness ΣC III]. Galaxies detected both in [C II] and C III] emission are annotated and represented as filled circles. Galaxies at 6 < z < 9 from Vallini et al. (2021) are represented as gray stars. Linear fit on the detected sources is shown as a blue line with 1σ uncertainties as a shaded region.
Current usage metrics show cumulative count of Article Views (full-text article views including HTML views, PDF and ePub downloads, according to the available data) and Abstracts Views on Vision4Press platform.
Data correspond to usage on the plateform after 2015. The current usage metrics is available 48-96 hours after online publication and is updated daily on week days.
Initial download of the metrics may take a while.