Fig. 5.
Download original image
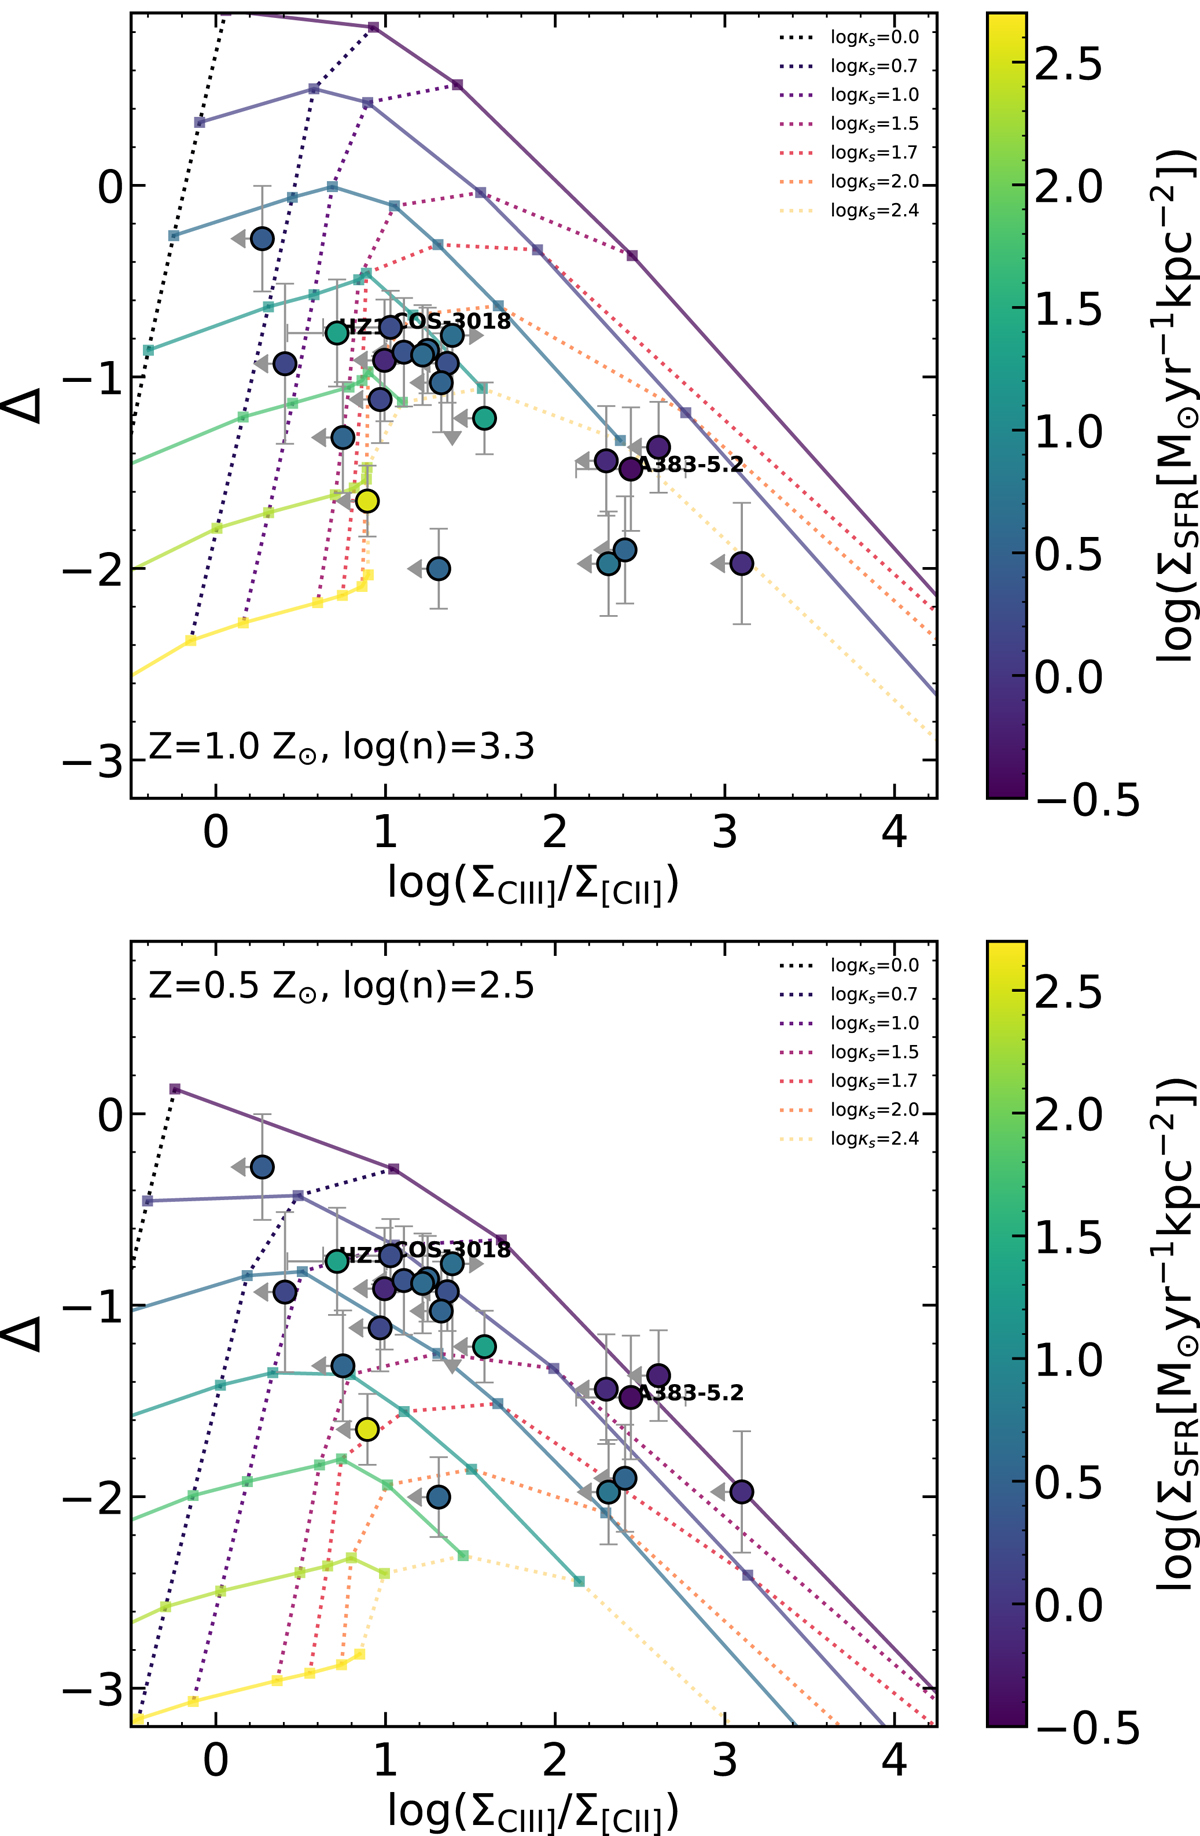
Deviation from the local Σ[C II] − ΣSFR relation Δ vs. the C III] over [C II] surface brightness ratio, color-coded by the SFR per unit area ΣSFR. Galaxies detected both in [C II] and C III] emission are annotated. We plot a grid of model predictions with fixed metallicity and gas density, with the burstiness parameter varying in a range of 0 ≤ log(κs) ≤ 2.4 i.e., κs = 1, 5, 10, 30, 50, 100, 250 (dotted lines), and log(ΣSFR[M⊙ yr−1]) in −0.5 ≤ log(ΣSFR[M⊙ yr−1]) ≤ 2.5 (solid lines). The top panel shows an example of a model prediction for high-z galaxies with ISM properties similar to HZ10, with solar metallicity Z = Z⊙ and gas density close to critical density of log(n[cm−3]) = 3.3. Bottom panel shows predictions for typical high-z galaxies with subsolar metallicity Z = 0.5 Z⊙ and log(n[cm−3]) = 2.5.
Current usage metrics show cumulative count of Article Views (full-text article views including HTML views, PDF and ePub downloads, according to the available data) and Abstracts Views on Vision4Press platform.
Data correspond to usage on the plateform after 2015. The current usage metrics is available 48-96 hours after online publication and is updated daily on week days.
Initial download of the metrics may take a while.