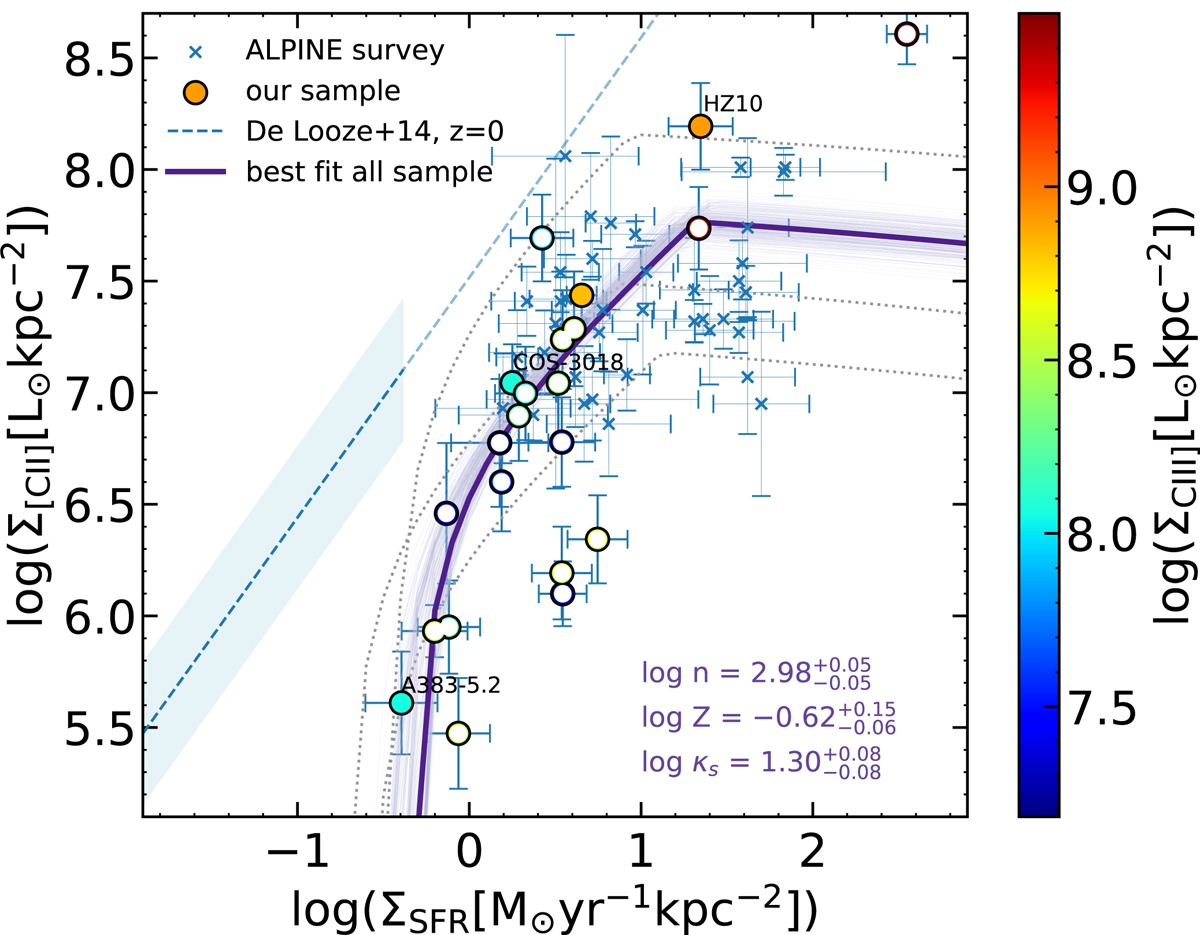
Fig. 4.
Download original image
[C II] surface brightness vs. SFR per unit area, color-coded by the C III] surface brightness, of this sample of galaxies. Filled and empty circles indicate sources with the C III] line detection and upper limits, respectively. Galaxies detected both in [C II] and C III] emission are annotated. Blue × symbols indicate a subsample of galaxies from the ALPINE survey at 4 < z < 6 (Le Fèvre et al. 2020). Σ[C II] − ΣSFR relation for local galaxies by De Looze et al. (2014) is represented as a blue dashed line with a 1σ dispersion of 0.32 dex. This relation is extrapolated to cover the distribution of high-z sources in Σ[C II] − ΣSFR space, which is shown as a light-blue dashed line. Σ[C II] − ΣSFR relation predictions from models of Ferrara et al. (2019) with three different combinations of fixed κs, Z, and n parameters (Table 5) are represented as dotted gray lines. Finally, the best-fit model (Z = 0.24 Z⊙, log(n[cm−3]) = 2.98, and log(κs) ≈ 1.30) on all the galaxies (excluding Z7_GND_42912) and 100 random samples from the MCMC chain are shown as thick and thin purple solid lines, respectively.
Current usage metrics show cumulative count of Article Views (full-text article views including HTML views, PDF and ePub downloads, according to the available data) and Abstracts Views on Vision4Press platform.
Data correspond to usage on the plateform after 2015. The current usage metrics is available 48-96 hours after online publication and is updated daily on week days.
Initial download of the metrics may take a while.