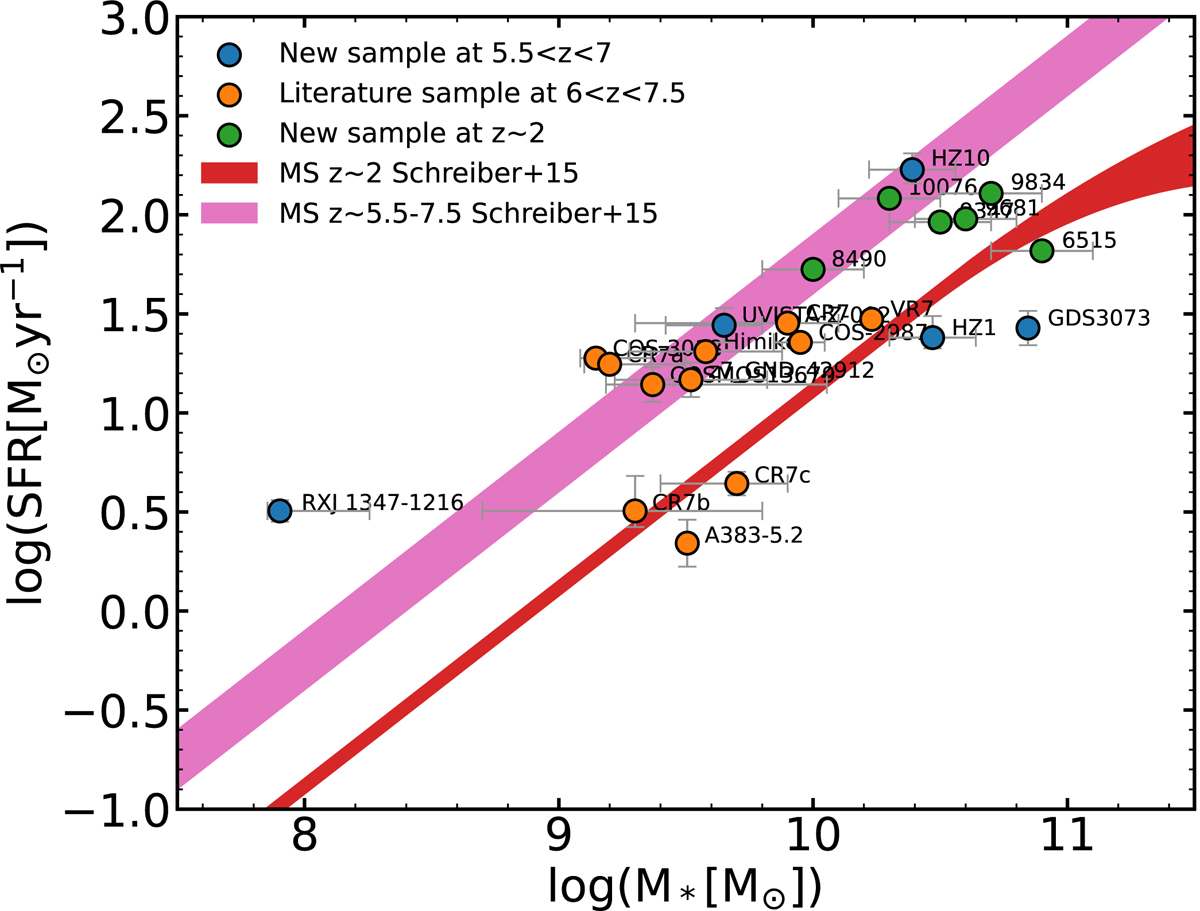
Fig. 1.
Download original image
SFR vs. stellar mass of our full galaxy sample. Sources at 5.5 < z < 7.5 with new and archival C III] data, galaxies at z ∼ 2 with archival C III] data, and literature sample at 6.0 < z < 7.5 are shown as blue, green, and orange circles, respectively. The best-fit relations for the main sequence (MS) at 5.5 < z < 7.5 and 1.7 < z < 2.0 from Schreiber et al. (2015) are shown as magenta and red bands, respectively. SFR and stellar mass references: HZ1, HZ10 – Capak et al. (2015); RXJ 1347−1216 – Huang et al. (2016), Bradač et al. (2017); GDS3073 – Grazian et al. (2020); UVISTA-Z-002 – Bowler et al. (2017a), Bouwens et al. (2022); COS-3018 – Smit et al. (2018); A383-5.2 – Matthee et al. (2019), Stark et al. (2015); z7_GND_42912 – Schaerer et al. (2015); Himiko – Carniani et al. (2018b), Graziani et al. (2020); CR7, CR7a, CR7b, CR7c – Matthee et al. (2017a); Bowler et al. (2014, 2017b); COS-13679 – Matthee et al. (2019), Laporte et al. (2017); COS-2987 – Smit et al. (2018), Laporte et al. (2017); VR7 – Matthee et al. (2019, 2017b); 9347, 6515, 10076, 9834, 9681, 8490 – this work, Zanella et al. (2018).
Current usage metrics show cumulative count of Article Views (full-text article views including HTML views, PDF and ePub downloads, according to the available data) and Abstracts Views on Vision4Press platform.
Data correspond to usage on the plateform after 2015. The current usage metrics is available 48-96 hours after online publication and is updated daily on week days.
Initial download of the metrics may take a while.