Fig. 8
Download original image
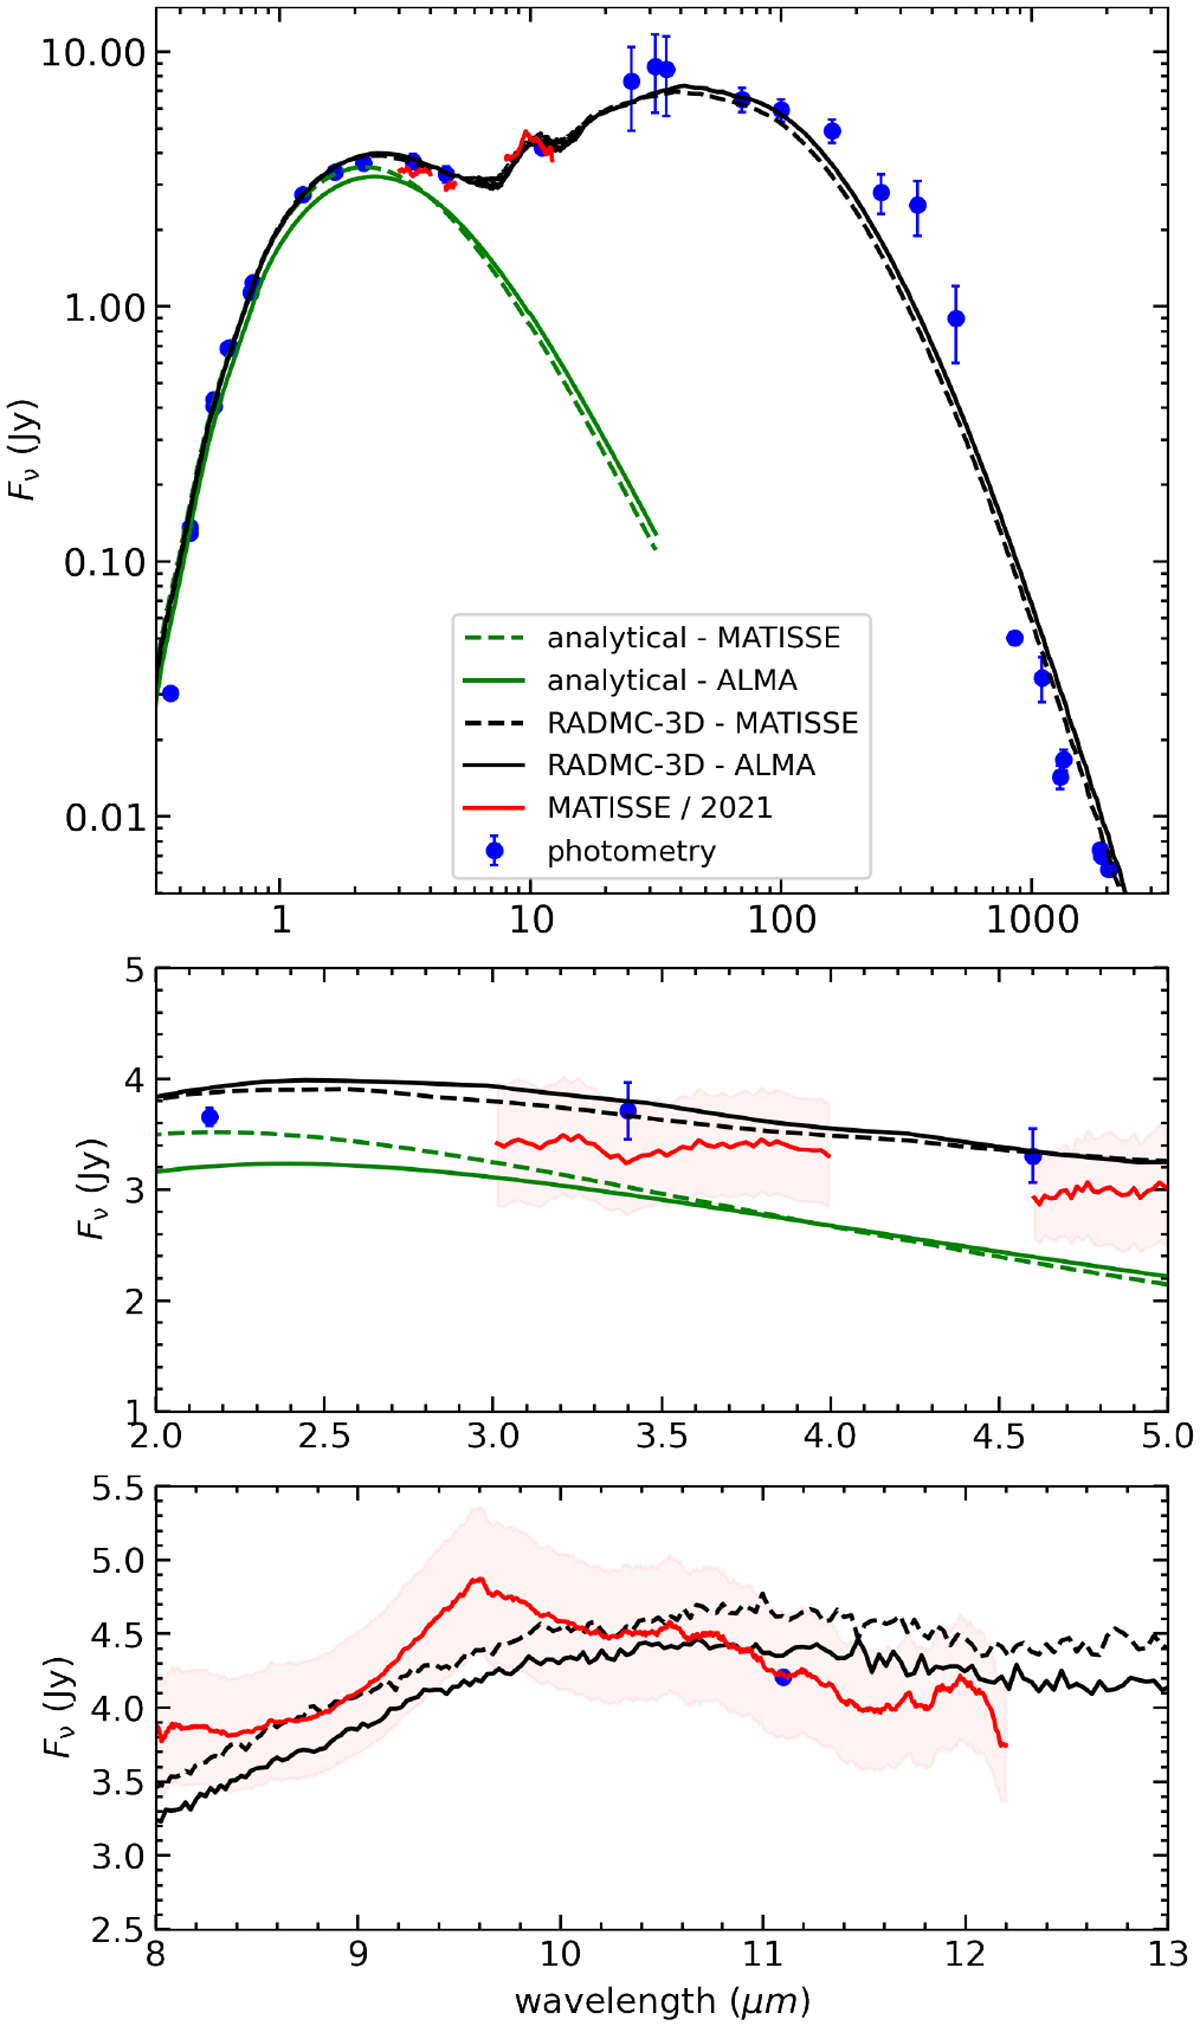
Spectral energy distribution comparing the contemporary photometry (blue circles; Table A.1) and the MATISSE spectrum (red; epoch 4) against the analytical (green) and RADMC-3D (black) models with the two disk orientations: ALMA (dashed lines) and MATISSE (solid lines). The bottom two panels are enlargements of the L- and N-band regions. The shaded regions represent the flux uncertainties of the MATISSE spectra, while the 9.4–9.9 µm spectral region is heavily affected by the terrestrial atmosphere.
Current usage metrics show cumulative count of Article Views (full-text article views including HTML views, PDF and ePub downloads, according to the available data) and Abstracts Views on Vision4Press platform.
Data correspond to usage on the plateform after 2015. The current usage metrics is available 48-96 hours after online publication and is updated daily on week days.
Initial download of the metrics may take a while.