Fig. B.1.
Download original image
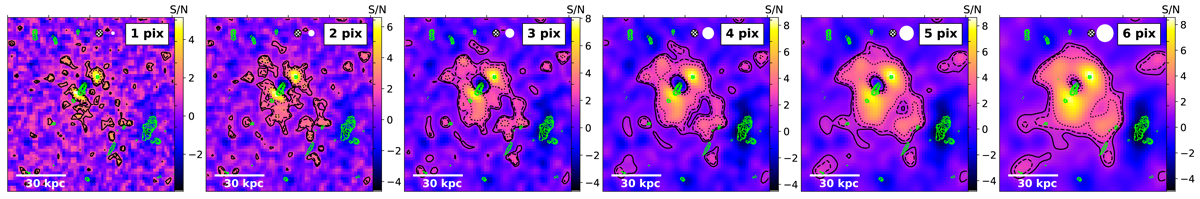
Mg II S/N map as constructed in Sect. 4.1 and smoothed using a 1, 2, 3, 4, 5, and 6 spaxel FWHM Gaussian from left to right, respectively. The FWHM values are indicated and shown as white circle (top right) in each panel. For comparison, the FWHM of the MUSE PSF is shown with a hatched white circle. The solid, dashed and dotted black contours correspond to a S/N of 1.5, 2 and 3, respectively. The adopted smoothing kernel has a FWHM of ![]() (i.e., 3 spaxels or ≈5 kpc at z = 1.31) and allows us to improve the S/N while keeping a good spatial resolution.
(i.e., 3 spaxels or ≈5 kpc at z = 1.31) and allows us to improve the S/N while keeping a good spatial resolution.
Current usage metrics show cumulative count of Article Views (full-text article views including HTML views, PDF and ePub downloads, according to the available data) and Abstracts Views on Vision4Press platform.
Data correspond to usage on the plateform after 2015. The current usage metrics is available 48-96 hours after online publication and is updated daily on week days.
Initial download of the metrics may take a while.