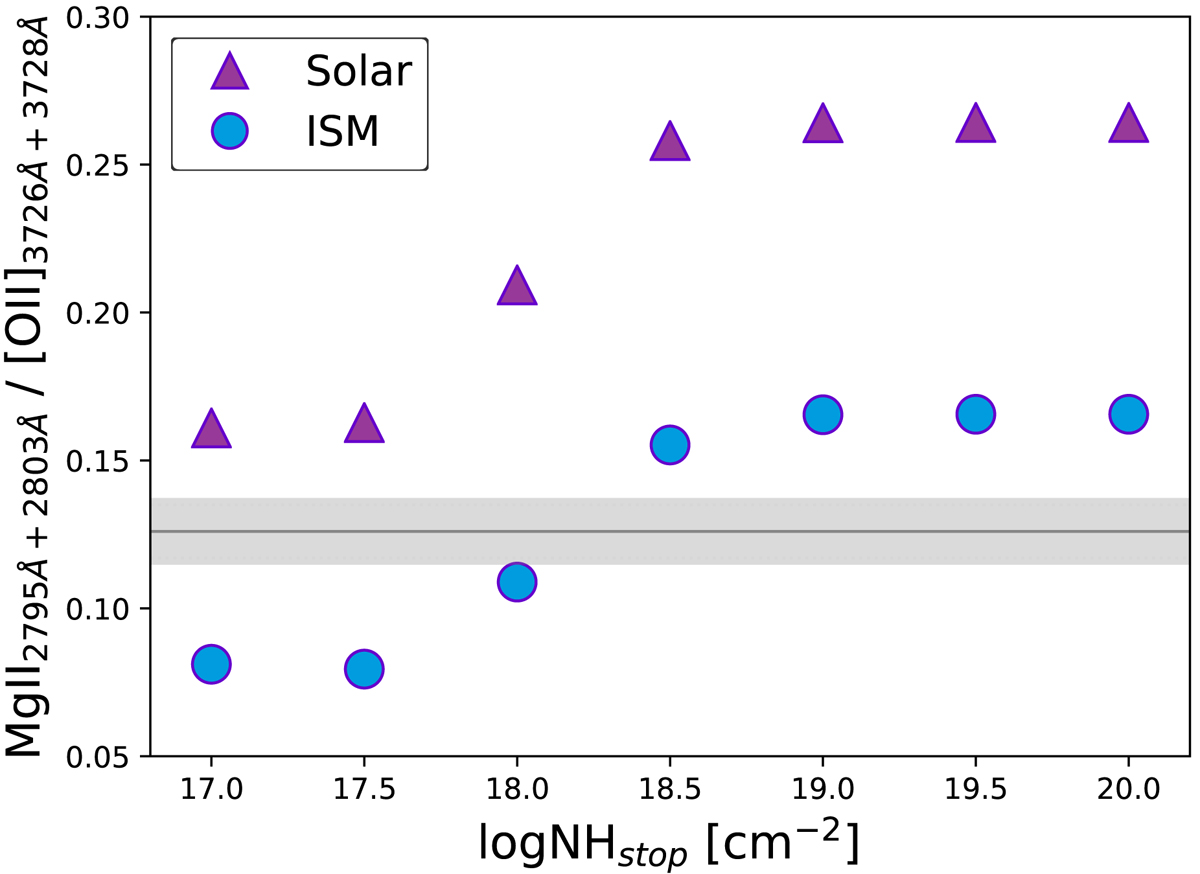
Fig. E.1.
Download original image
Predicted intrinsic nebular Mg II to [O II] ratio using Cloudy models constrained by the best fit parameters of the observations (see SEDs in the right panel). The symbols represent the chemical abundances used, triangles for solar and circles for ISM. The horizontal gray line and shaded area show the observed Mg II to [O II] ratio from the group and the 1σ uncertainties, respectively.
Current usage metrics show cumulative count of Article Views (full-text article views including HTML views, PDF and ePub downloads, according to the available data) and Abstracts Views on Vision4Press platform.
Data correspond to usage on the plateform after 2015. The current usage metrics is available 48-96 hours after online publication and is updated daily on week days.
Initial download of the metrics may take a while.