Fig. 19.
Download original image
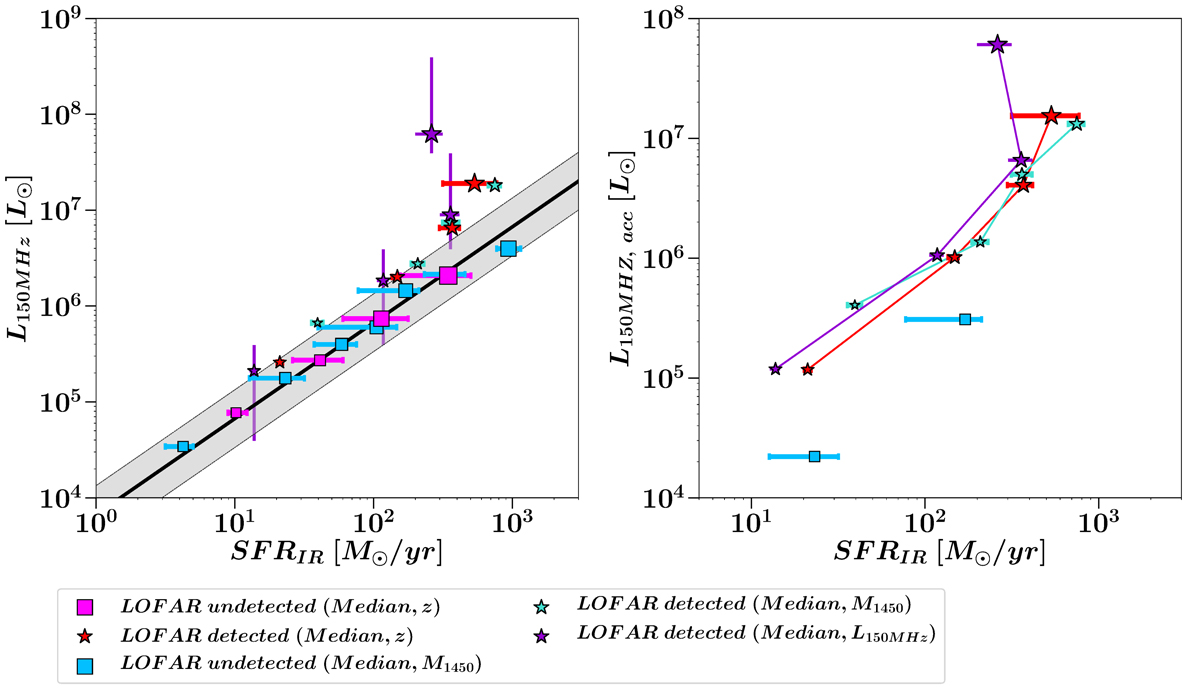
Comparison between the infrared star-formation rates, SFRsIR, and the total and accretion radio luminosities at 150 MHz. Left: SFRsIR of the median quasar samples versus their total radio luminosities at 150 MHz. Error bars on the x-axis indicate 1σ errors on the SFRsIR, while y-axis error bars for LOFAR quasars stacked according to their radio luminosity denotes the bin size used. The dashed line is the far-infrared radio correlation (FIRC) at L150 MHz derived by Calistro-Rivera et al. (2017). The gray shaded region indicates the spread of the FIRC scaled by a factor of ±2. Right: SFRIR versus the radio luminosity associated with AGN accretion, L150MHz, acc. The radio luminosity connected to AGN accretion is calculated by subtracting the contribution of SF to the total radio luminosity estimated using the FIRC. Negative AGN feedback could be taken place in the hosts of RDQs with the highest 150 MHz radio luminosities due to their radio-emission being dominated by AGN accretion, and the relative lower SFRIR.
Current usage metrics show cumulative count of Article Views (full-text article views including HTML views, PDF and ePub downloads, according to the available data) and Abstracts Views on Vision4Press platform.
Data correspond to usage on the plateform after 2015. The current usage metrics is available 48-96 hours after online publication and is updated daily on week days.
Initial download of the metrics may take a while.