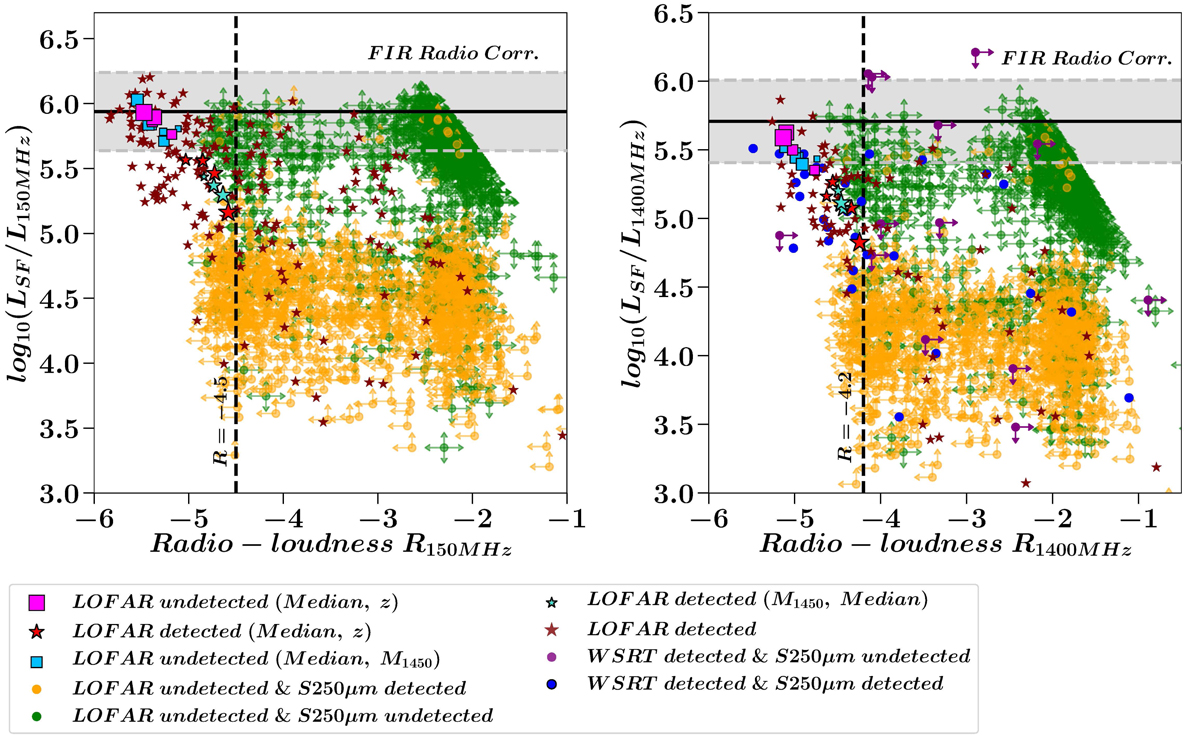
Fig. 17.
Download original image
Infrared star formation luminosity, LSF, versus radio-loudness, R, for the quasar samples. The measurements for median LOFAR radio-undetected quasars (RUQs, fuchsia squares), median LOFAR radio-undetected quasars (RDQs, red stars), RDQs (maroon stars) and RUQs detected by SPIRE at 250 μm (orange circles), and RUQs undetected by SPIRE and WSRT at 250 μm and 1.4 GHz (green circles), respectively. The measurements for RUQs detected by WSRT, but undetected by SPIRE at 250 μm (purple circles, right); and RUQs detected by both SPIRE and WSRT at 250 μm and 1.4 GHz (blue circles, right), respectively are also displayed. Upper limits in either LSF or L150 MHz are indicated by arrows. The solid line is the far-infrared radio correlation (FIRC) at 150 MHz and 1.4 GHz. The gray shaded region indicates the spread of the FIRC scaled by a factor of ±2. The dashed vertical lines (R = −4.5 at 150 MHz and R = −4.2 at 1.4 GHz) denote the threshold between radio-loud and radio-quiet quasars (see Sect. 6 for more details). The radio-emission of bright RDQs with R ≳ −4.5 is consistent with being dominated by SMBH accretion, while for lower radio luminosity quasars with R < −4.5 the relative contribution of SF to their radio fluxes becomes more important.
Current usage metrics show cumulative count of Article Views (full-text article views including HTML views, PDF and ePub downloads, according to the available data) and Abstracts Views on Vision4Press platform.
Data correspond to usage on the plateform after 2015. The current usage metrics is available 48-96 hours after online publication and is updated daily on week days.
Initial download of the metrics may take a while.